QUESTION IMAGE
Question
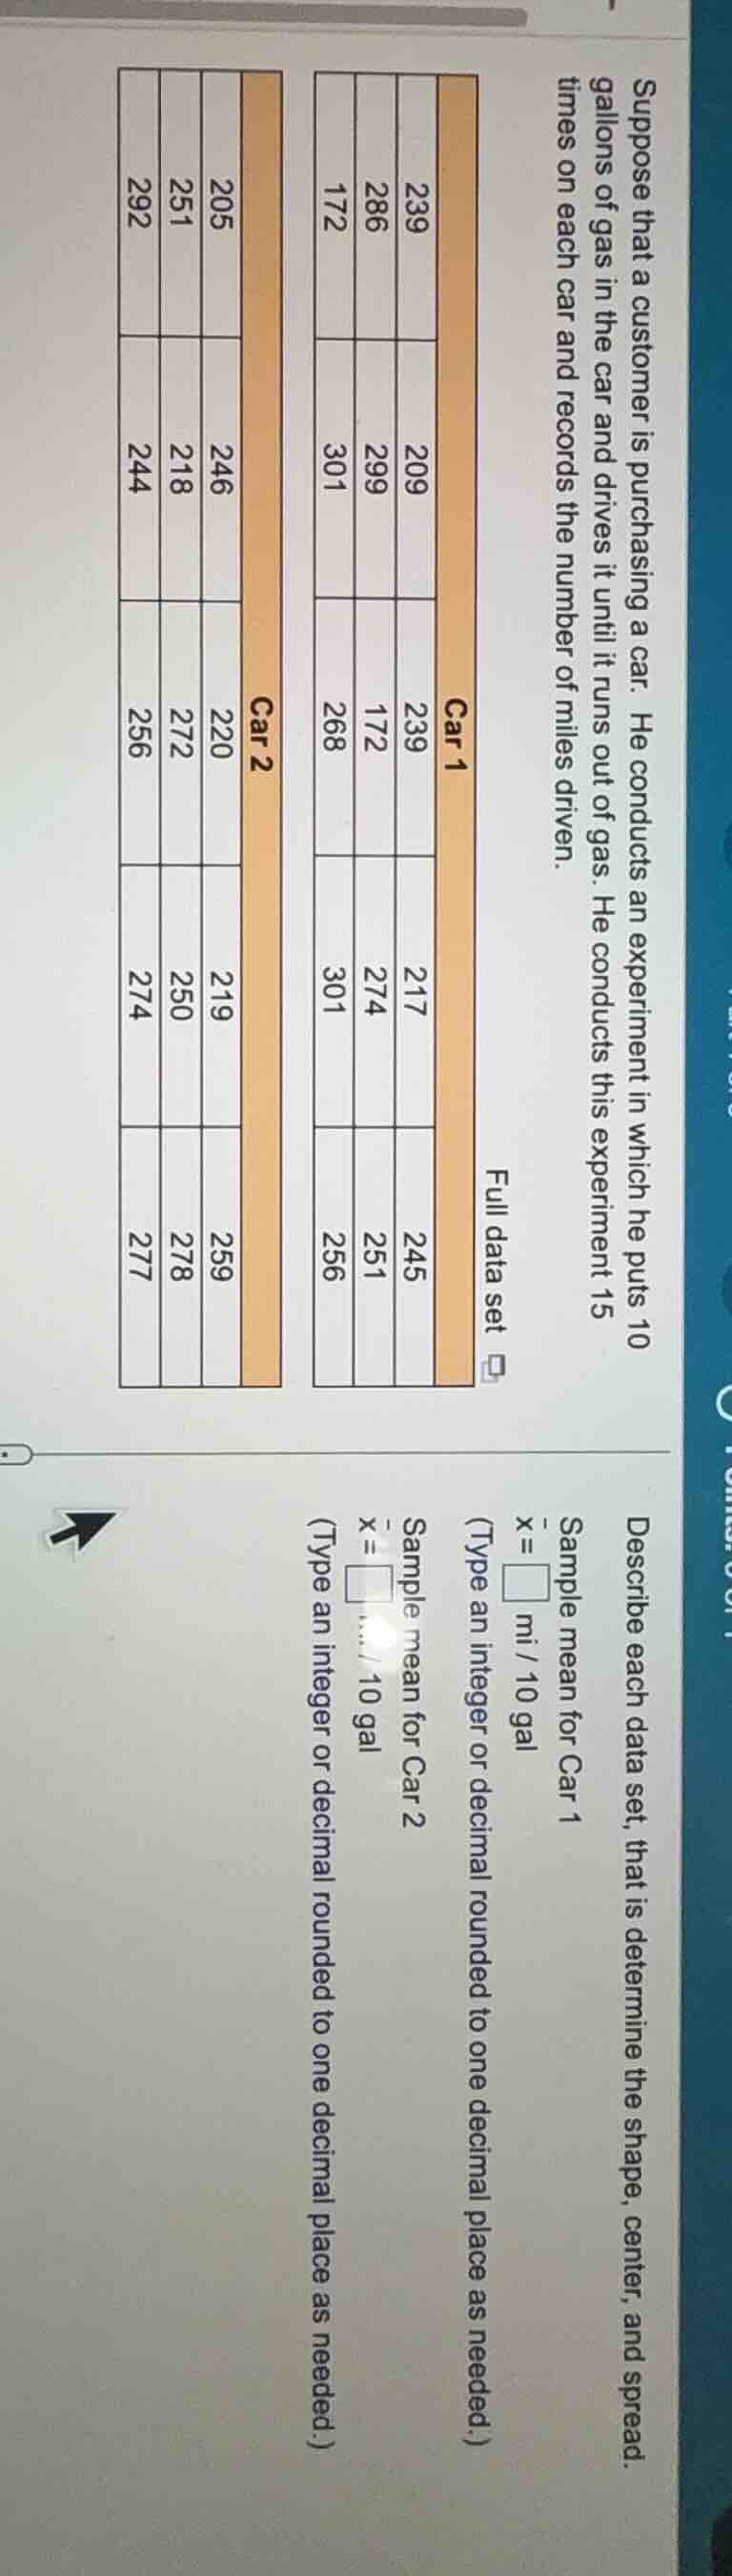
suppose that a customer is purchasing a car. he conducts an experiment in which he puts 10 gallons of gas in the car and drives it until it runs out of gas. he conducts this experiment 15 times on each car and records the number of miles driven. full data set car 1: 239, 209, 239, 217, 245, 286, 299, 172, 274, 251, 172, 301, 268, 301, 256 car 2: 205, 246, 220, 219, 259, 251, 218, 272, 250, 278, 292, 244, 256, 274, 277 describe each data set, that is determine the shape, center, and spread. sample mean for car 1 (\bar{x}=) (square) mi / 10 gal (type an integer or decimal rounded to one decimal place as needed.) sample mean for car 2 (\bar{x}=) (square) mi / 10 gal (type an integer or decimal rounded to one decimal place as needed.)
Step1: Sum Car 1's mileage
$239 + 209 + 239 + 217 + 245 + 286 + 299 + 172 + 274 + 251 + 172 + 301 + 268 + 301 + 256 = 3929$
Step2: Calculate Car 1's sample mean
$\bar{x}_1 = \frac{3929}{15} \approx 261.9$
Step3: Sum Car 2's mileage
$205 + 246 + 220 + 219 + 259 + 251 + 218 + 272 + 250 + 278 + 292 + 244 + 256 + 274 + 277 = 3861$
Step4: Calculate Car 2's sample mean
$\bar{x}_2 = \frac{3861}{15} \approx 257.4$

Snap & solve any problem in the app
Get step-by-step solutions on Sovi AI
Photo-based solutions with guided steps
Explore more problems and detailed explanations
Sample mean for Car 1: $261.9$ mi / 10 gal
Sample mean for Car 2: $257.4$ mi / 10 gal
Additional Shape, Center, Spread Context:
- Center: Car 1 has a higher average mileage per 10 gallons than Car 2.
- Spread (Range): Car 1 range: $301 - 172 = 129$ mi/10gal; Car 2 range: $292 - 205 = 87$ mi/10gal, so Car 1's data is more spread out.
- Shape: Both datasets appear roughly symmetric when plotted, with most values clustered near their respective means.