QUESTION IMAGE
Question
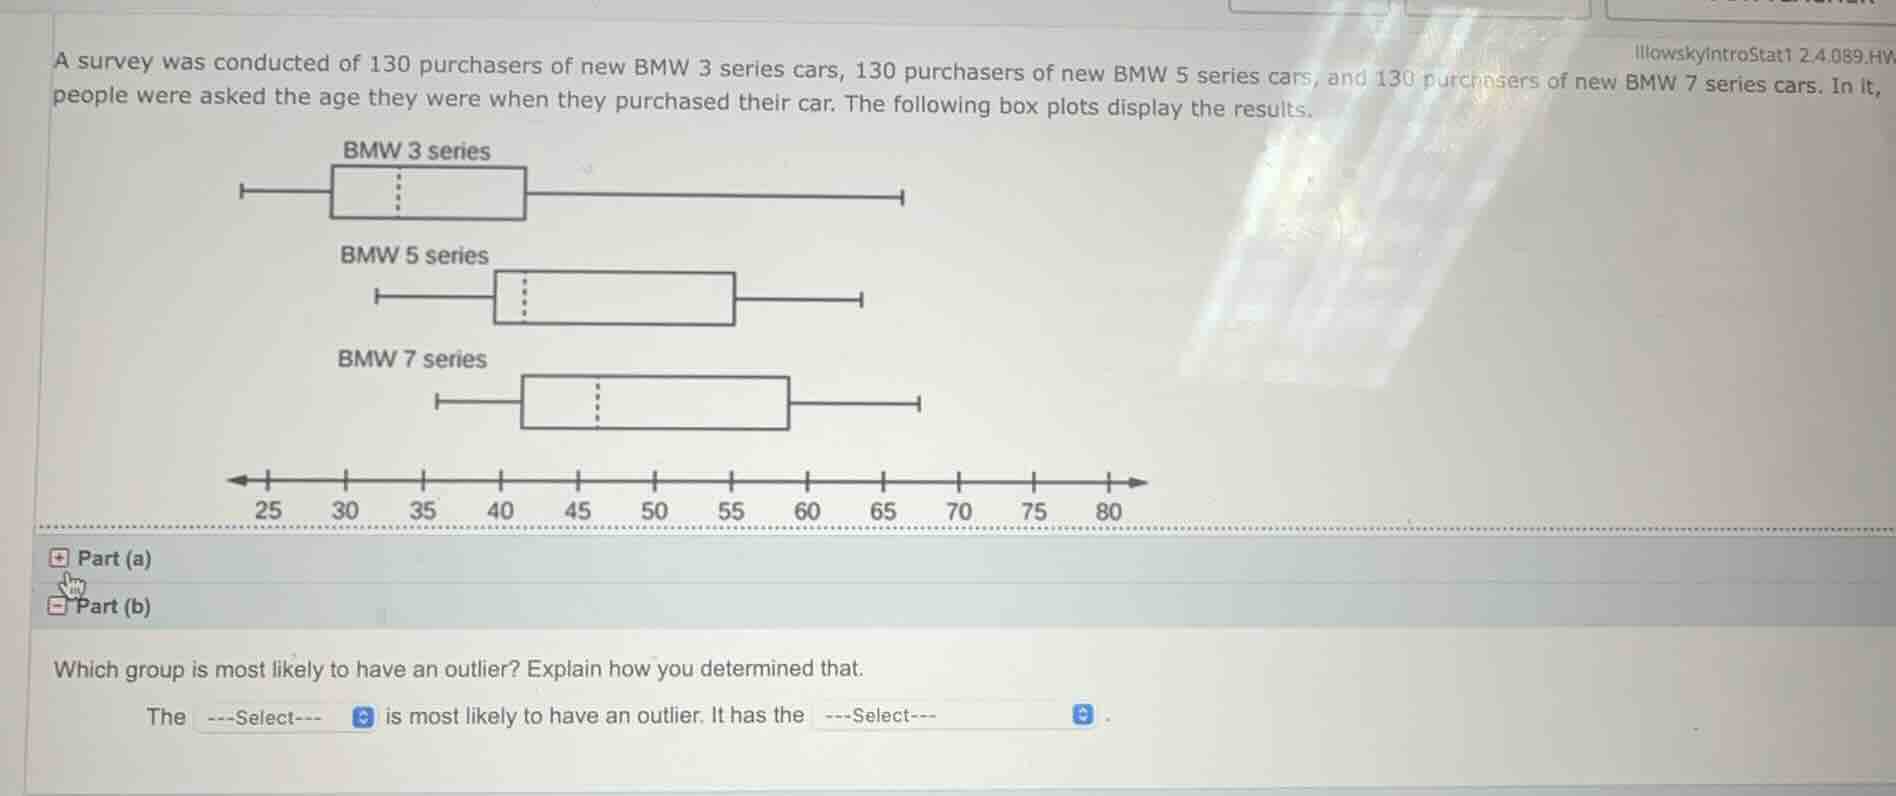
a survey was conducted of 130 purchasers of new bmw 3 series cars, 130 purchasers of new bmw 5 series cars, and 130 purchasers of new bmw 7 series cars. in it, people were asked the age they were when they purchased their car. the following box plots display the results. part (a) part (b) which group is most likely to have an outlier? explain how you determined that. the ---select--- is most likely to have an outlier. it has the ---select---.
To determine which group is most likely to have an outlier, we analyze the box - plots. An outlier is a data point that is far from the main cluster of data. In a box - plot, we can look at the length of the whiskers and the spread of the data. The BMW 3 series group has a whisker (the line extending from the box) that is much longer on one side (the right - hand side in this case) compared to the other groups (BMW 5 series and BMW 7 series). A long whisker indicates that there are data points that are far from the inter - quartile range (the range covered by the box), which are potential outliers. So, we compare the whisker lengths of the three box - plots. The BMW 3 series has the longest whisker, meaning it has data points that are far from the middle 50% of the data (the box), so it is most likely to have an outlier.

Snap & solve any problem in the app
Get step-by-step solutions on Sovi AI
Photo-based solutions with guided steps
Explore more problems and detailed explanations
The BMW 3 series is most likely to have an outlier. It has the longest whisker (or a whisker that extends far from the box, indicating potential extreme values).