QUESTION IMAGE
Question
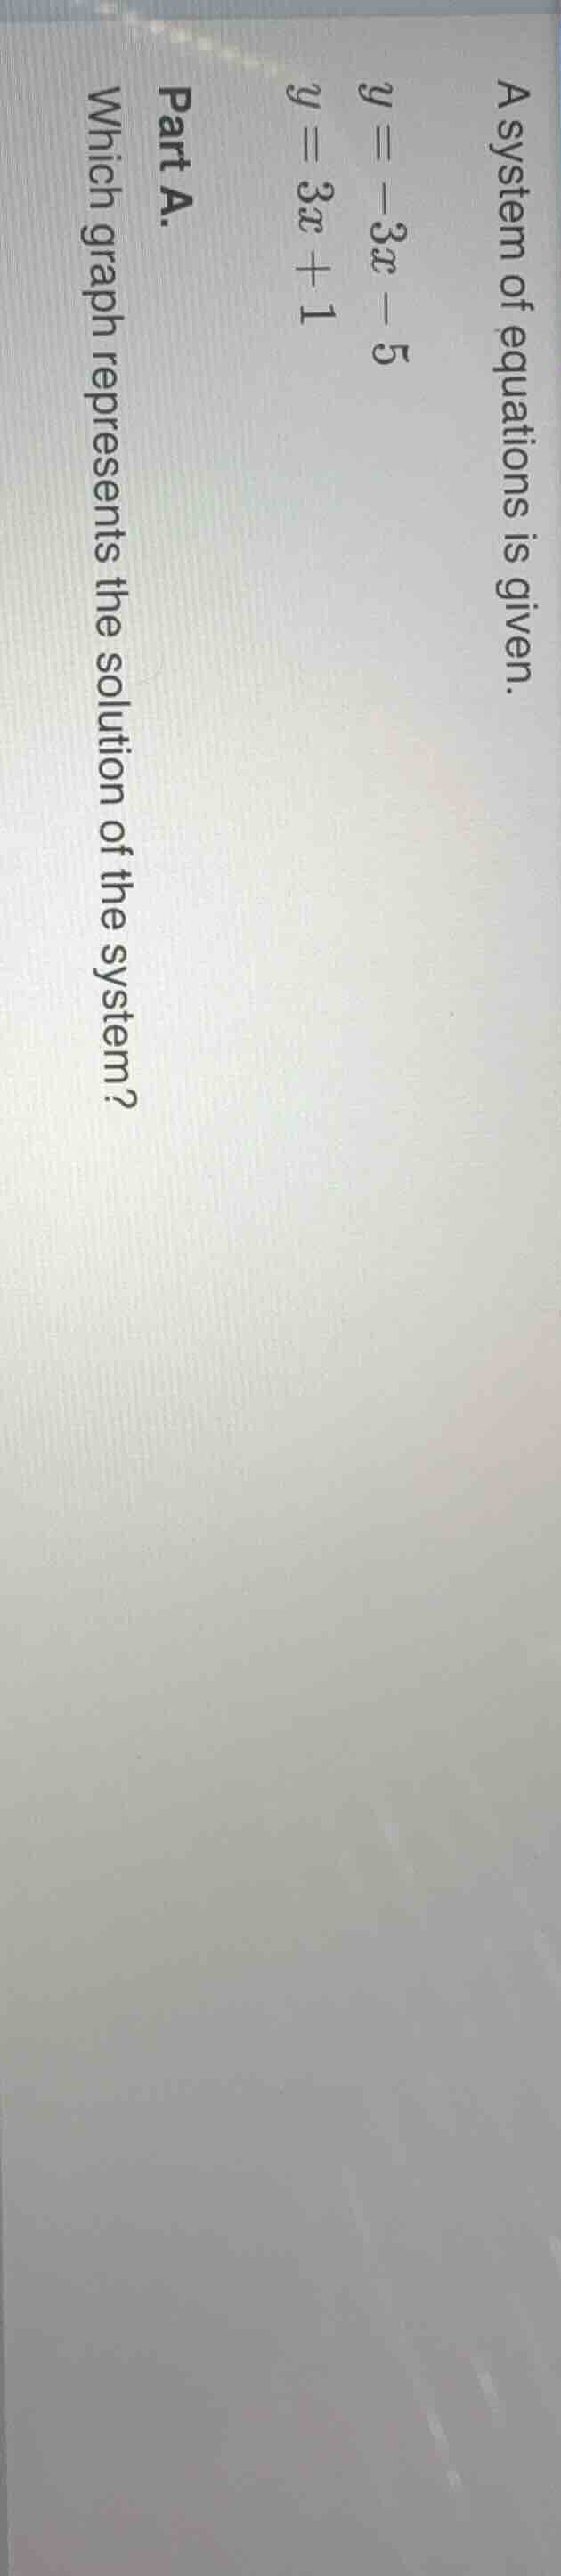
a system of equations is given.
y = -3x - 5
y = 3x + 1
part a.
which graph represents the solution of the system?
To determine the graph of the system \(
\), we first find the solution (intersection point) by solving the system.
Step 1: Set the equations equal
Since both equal \( y \), set \( -3x - 5 = 3x + 1 \).
Step 2: Solve for \( x \)
Add \( 3x \) to both sides:
\( -5 = 6x + 1 \)
Subtract \( 1 \) from both sides:
\( -6 = 6x \)
Divide by \( 6 \):
\( x = -1 \)
Step 3: Find \( y \)
Substitute \( x = -1 \) into \( y = 3x + 1 \):
\( y = 3(-1) + 1 = -3 + 1 = -2 \)
The solution is \( (-1, -2) \). To identify the graph:
- For \( y = -3x - 5 \): Slope \( -3 \), y-intercept \( -5 \) (line goes down from left to right, crosses y-axis at \( (0, -5) \)).
- For \( y = 3x + 1 \): Slope \( 3 \), y-intercept \( 1 \) (line goes up from left to right, crosses y-axis at \( (0, 1) \)).
- The lines intersect at \( (-1, -2) \).
The graph with two lines: one with slope \( -3 \) (decreasing) through \( (0, -5) \), one with slope \( 3 \) (increasing) through \( (0, 1) \), intersecting at \( (-1, -2) \) represents the system.

Snap & solve any problem in the app
Get step-by-step solutions on Sovi AI
Photo-based solutions with guided steps
Explore more problems and detailed explanations
To determine the graph of the system \(
\), we first find the solution (intersection point) by solving the system.
Step 1: Set the equations equal
Since both equal \( y \), set \( -3x - 5 = 3x + 1 \).
Step 2: Solve for \( x \)
Add \( 3x \) to both sides:
\( -5 = 6x + 1 \)
Subtract \( 1 \) from both sides:
\( -6 = 6x \)
Divide by \( 6 \):
\( x = -1 \)
Step 3: Find \( y \)
Substitute \( x = -1 \) into \( y = 3x + 1 \):
\( y = 3(-1) + 1 = -3 + 1 = -2 \)
The solution is \( (-1, -2) \). To identify the graph:
- For \( y = -3x - 5 \): Slope \( -3 \), y-intercept \( -5 \) (line goes down from left to right, crosses y-axis at \( (0, -5) \)).
- For \( y = 3x + 1 \): Slope \( 3 \), y-intercept \( 1 \) (line goes up from left to right, crosses y-axis at \( (0, 1) \)).
- The lines intersect at \( (-1, -2) \).
The graph with two lines: one with slope \( -3 \) (decreasing) through \( (0, -5) \), one with slope \( 3 \) (increasing) through \( (0, 1) \), intersecting at \( (-1, -2) \) represents the system.