QUESTION IMAGE
Question
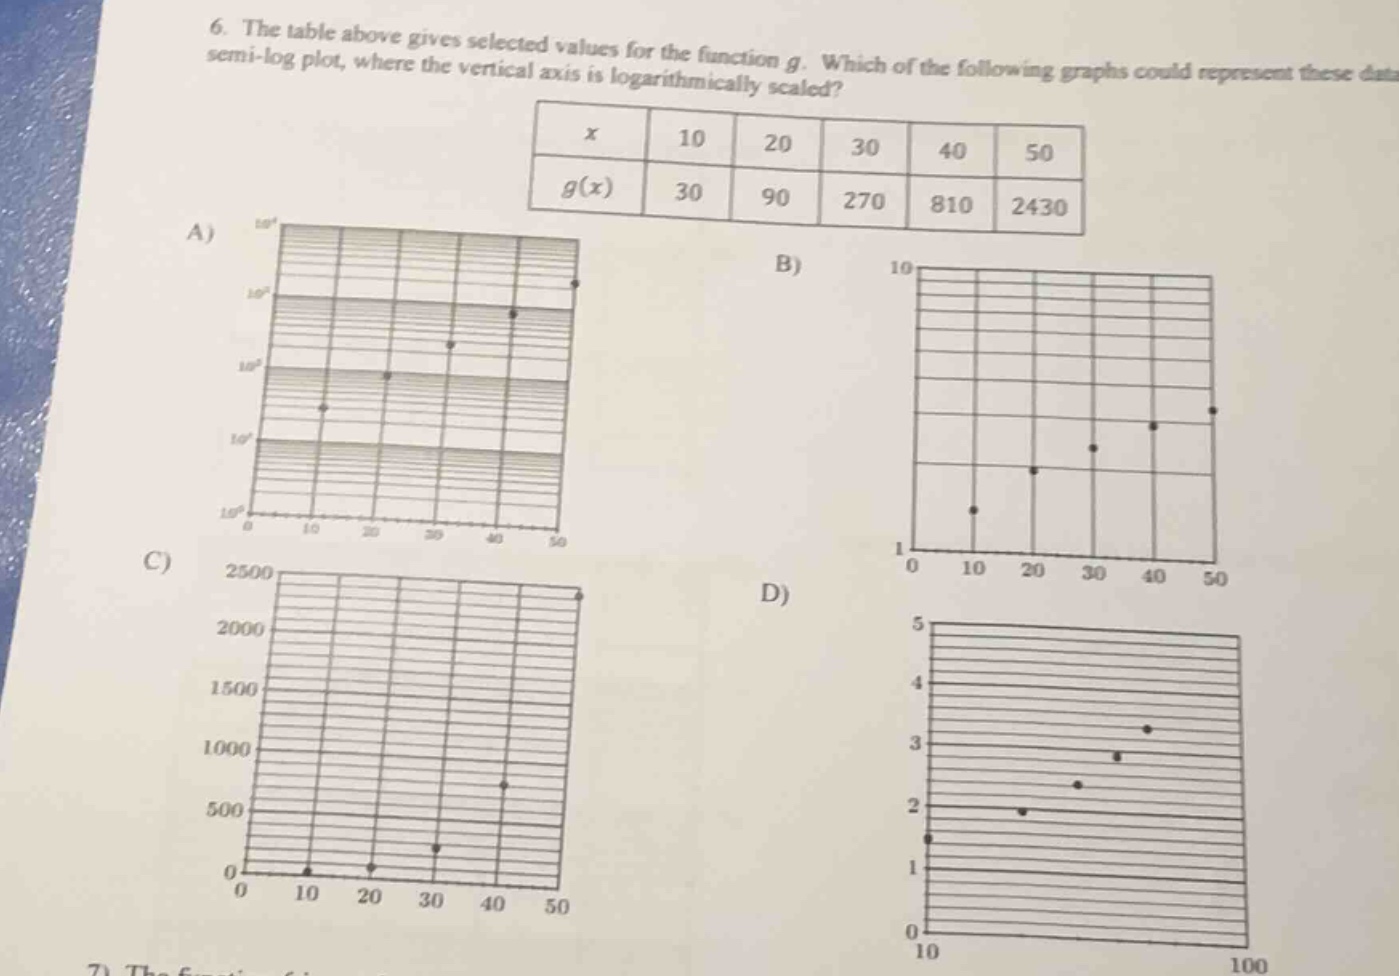
- the table above gives selected values for the function g. which of the following graphs could represent these data semi - log plot, where the vertical axis is logarithmically scaled?
| x | 10 | 20 | 30 | 40 | 50 |
| g(x) | 30 | 90 | 270 | 810 | 2430 |
a) graph a
b) graph b
c) graph c
d) graph d
Step1: Identify g(x) growth pattern
Check ratio of consecutive $g(x)$ values:
$\frac{90}{30}=3$, $\frac{270}{90}=3$, $\frac{810}{270}=3$, $\frac{2430}{810}=3$
So $g(x)$ follows $g(x)=30 \cdot 3^{\frac{x-10}{10}}$, an exponential function.
Step2: Semi-log plot property
For exponential functions $y = ab^x$, $\log(y) = \log(a) + x\log(b)$, which is linear in a semi-log plot (logarithmic vertical axis). We need to verify the log values of $g(x)$:
$\log_{10}(30)\approx1.477$, $\log_{10}(90)\approx1.954$, $\log_{10}(270)\approx2.431$, $\log_{10}(810)\approx2.908$, $\log_{10}(2430)\approx3.386$
These values increase linearly as $x$ increases by 10 each time.
Step3: Match to correct graph
Graph A has a logarithmic vertical axis ($10^1,10^2,10^3,10^4$) and the plotted points form a straight line, matching the linear relationship of $\log(g(x))$ vs $x$. Graphs B, C, D do not have a logarithmic vertical axis with linear plotted points for this data.

Snap & solve any problem in the app
Get step-by-step solutions on Sovi AI
Photo-based solutions with guided steps
Explore more problems and detailed explanations
A) [The semi-log graph with vertical axis marked $10^1, 10^2, 10^3, 10^4$ and points forming a straight line]