QUESTION IMAGE
Question
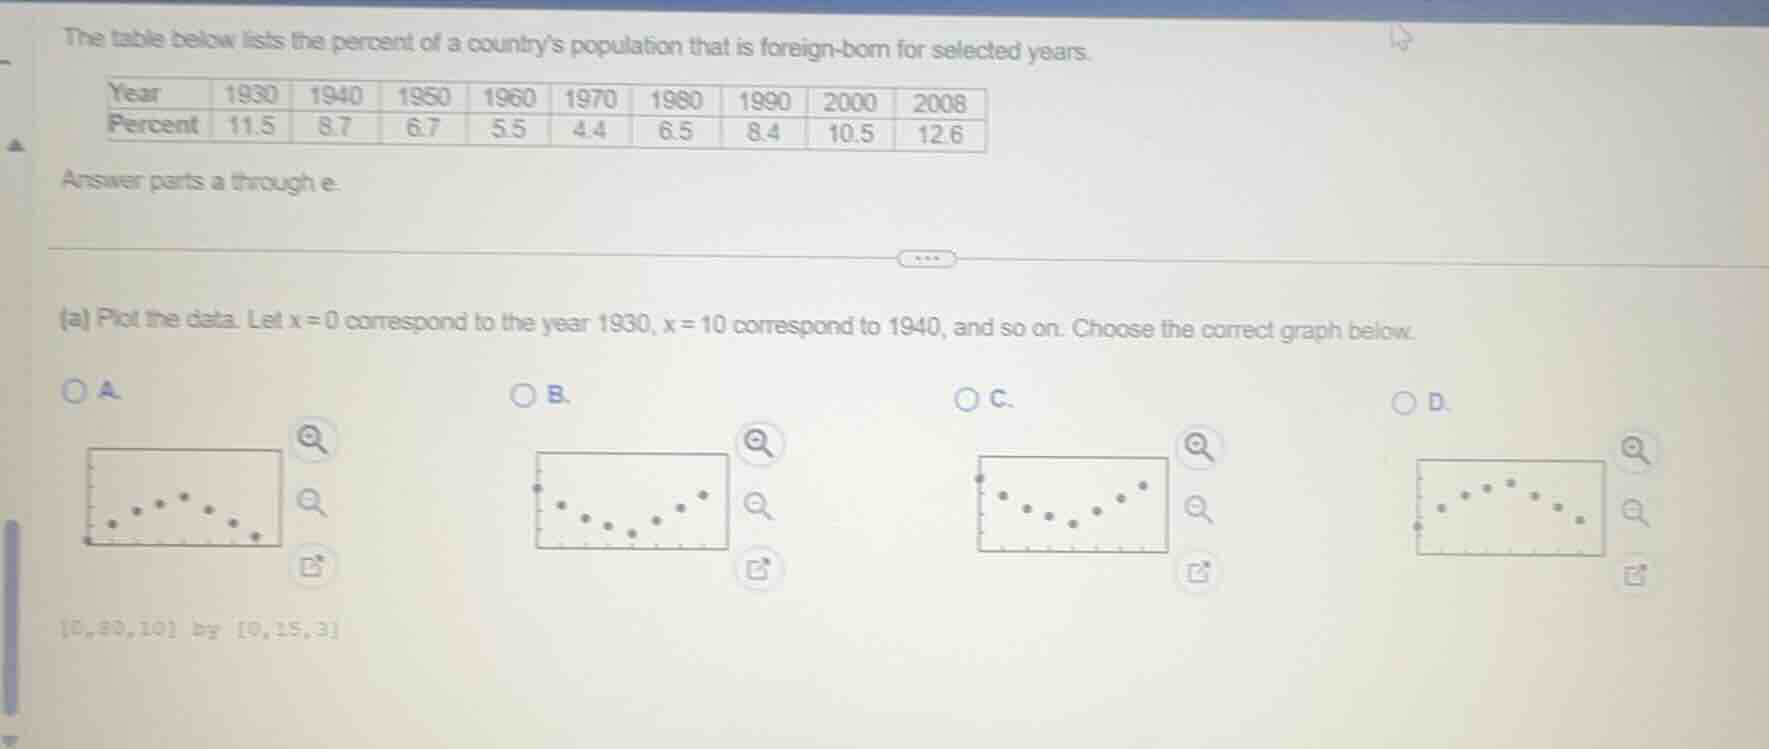
the table below lists the percent of a countrys population that is foreign-born for selected years.
| year | 1930 | 1940 | 1950 | 1960 | 1970 | 1980 | 1990 | 2000 | 2008 |
| percent | 11.5 | 8.7 | 6.7 | 5.5 | 4.4 | 6.5 | 8.4 | 10.5 | 12.6 |
answer parts a through e.
(a) plot the data. let x = 0 correspond to the year 1930, x = 10 correspond to 1940, and so on. choose the correct graph below.
a.
b.
c.
d.
0,80,10 by 0,15,3
First, map the years to x-values: 1930→0, 1940→10, 1950→20, 1960→30, 1970→40, 1980→50, 1990→60, 2000→70, 2008→78. Then list the (x, percent) pairs: (0,11.5), (10,8.7), (20,6.7), (30,5.5), (40,4.4), (50,6.5), (60,8.4), (70,10.5), (78,12.6). The data first decreases to x=40, then increases steadily. Match this trend to the graphs: Graph B shows an initial decrease then a steady increase, which matches the data.

Snap & solve any problem in the app
Get step-by-step solutions on Sovi AI
Photo-based solutions with guided steps
Explore more problems and detailed explanations
B. [Graph showing initial decrease then steady increase]