QUESTION IMAGE
Question
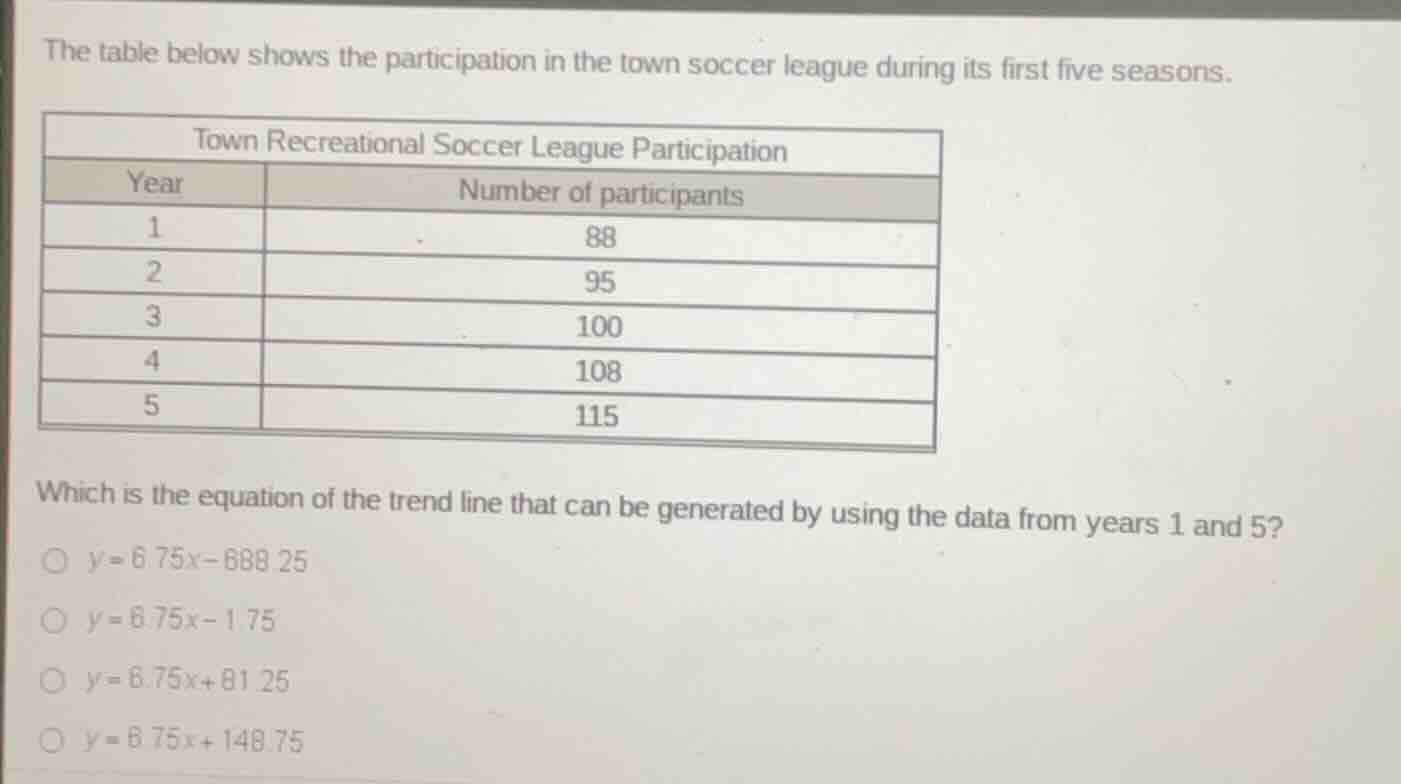
the table below shows the participation in the town soccer league during its first five seasons.
town recreational soccer league participation
| year | number of participants |
|---|---|
| 2 | 95 |
| 3 | 100 |
| 4 | 108 |
| 5 | 115 |
which is the equation of the trend line that can be generated by using the data from years 1 and 5?
○ $y = 6.75x - 688.25$
○ $y = 6.75x - 1.75$
○ $y = 6.75x + 81.25$
○ $y = 6.75x + 148.75$
Step1: Identify two data points
The points are $(x_1,y_1)=(1,88)$ and $(x_2,y_2)=(5,115)$
Step2: Calculate slope $m$
$m=\frac{y_2-y_1}{x_2-x_1}=\frac{115-88}{5-1}=\frac{27}{4}=6.75$
Step3: Find y-intercept $b$
Use $y=mx+b$ with $(1,88)$:
$88=6.75(1)+b$
$b=88-6.75=81.25$
Step4: Form trend line equation
$y=6.75x+81.25$

Snap & solve any problem in the app
Get step-by-step solutions on Sovi AI
Photo-based solutions with guided steps
Explore more problems and detailed explanations
$y=6.75x+81.25$ (the third option)