QUESTION IMAGE
Question
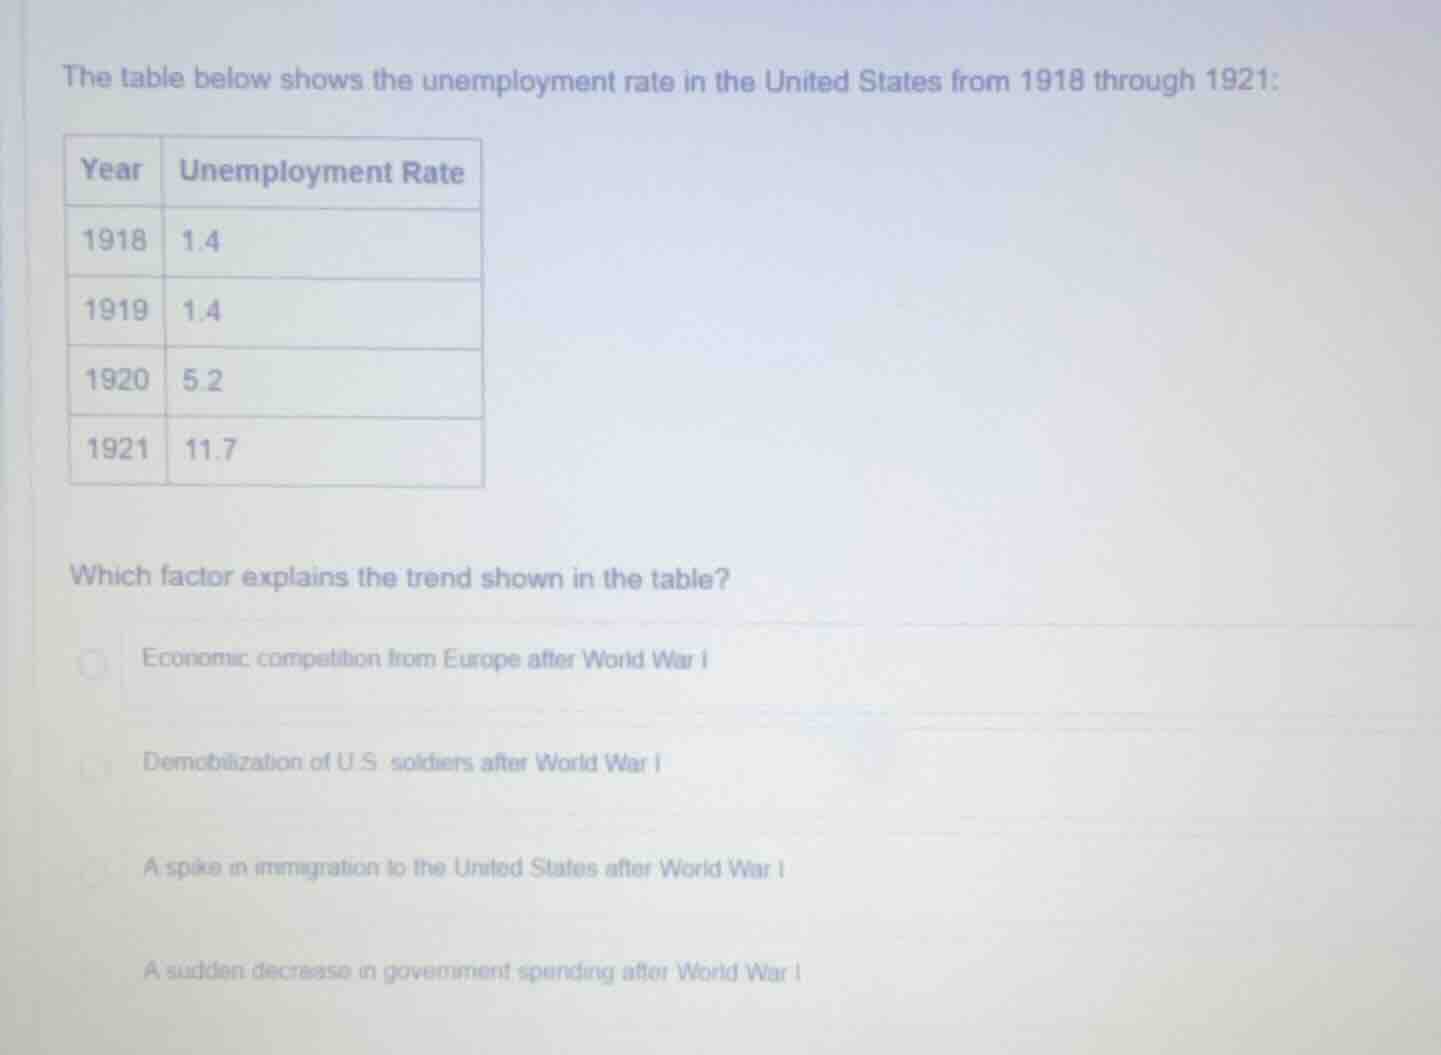
the table below shows the unemployment rate in the united states from 1918 through 1921:
| year | unemployment rate |
|---|---|
| 1919 | 1.4 |
| 1920 | 5.2 |
| 1921 | 11.7 |
which factor explains the trend shown in the table?
- economic competition from europe after world war i
- demobilization of u.s. soldiers after world war i
- a spike in immigration to the united states after world war i
- a sudden decrease in government spending after world war i
Brief Explanations
The table shows a sharp rise in US unemployment from 1918-1921. After WWI, the U.S. government cut massive military spending that had supported the war effort. This sudden reduction in government demand for goods, services, and labor led to a contraction in the economy, directly driving up unemployment.
- European economic competition was limited post-WWI as Europe's economies were devastated.
- While demobilized soldiers re-entered the workforce, the scale of government spending cuts was the primary driver of the severe 1920-1921 recession.
- Immigration did not spike sharply in this period; in fact, immigration restrictions were implemented around this time.

Snap & solve any problem in the app
Get step-by-step solutions on Sovi AI
Photo-based solutions with guided steps
Explore more problems and detailed explanations
A sudden decrease in government spending after World War I