QUESTION IMAGE
Question
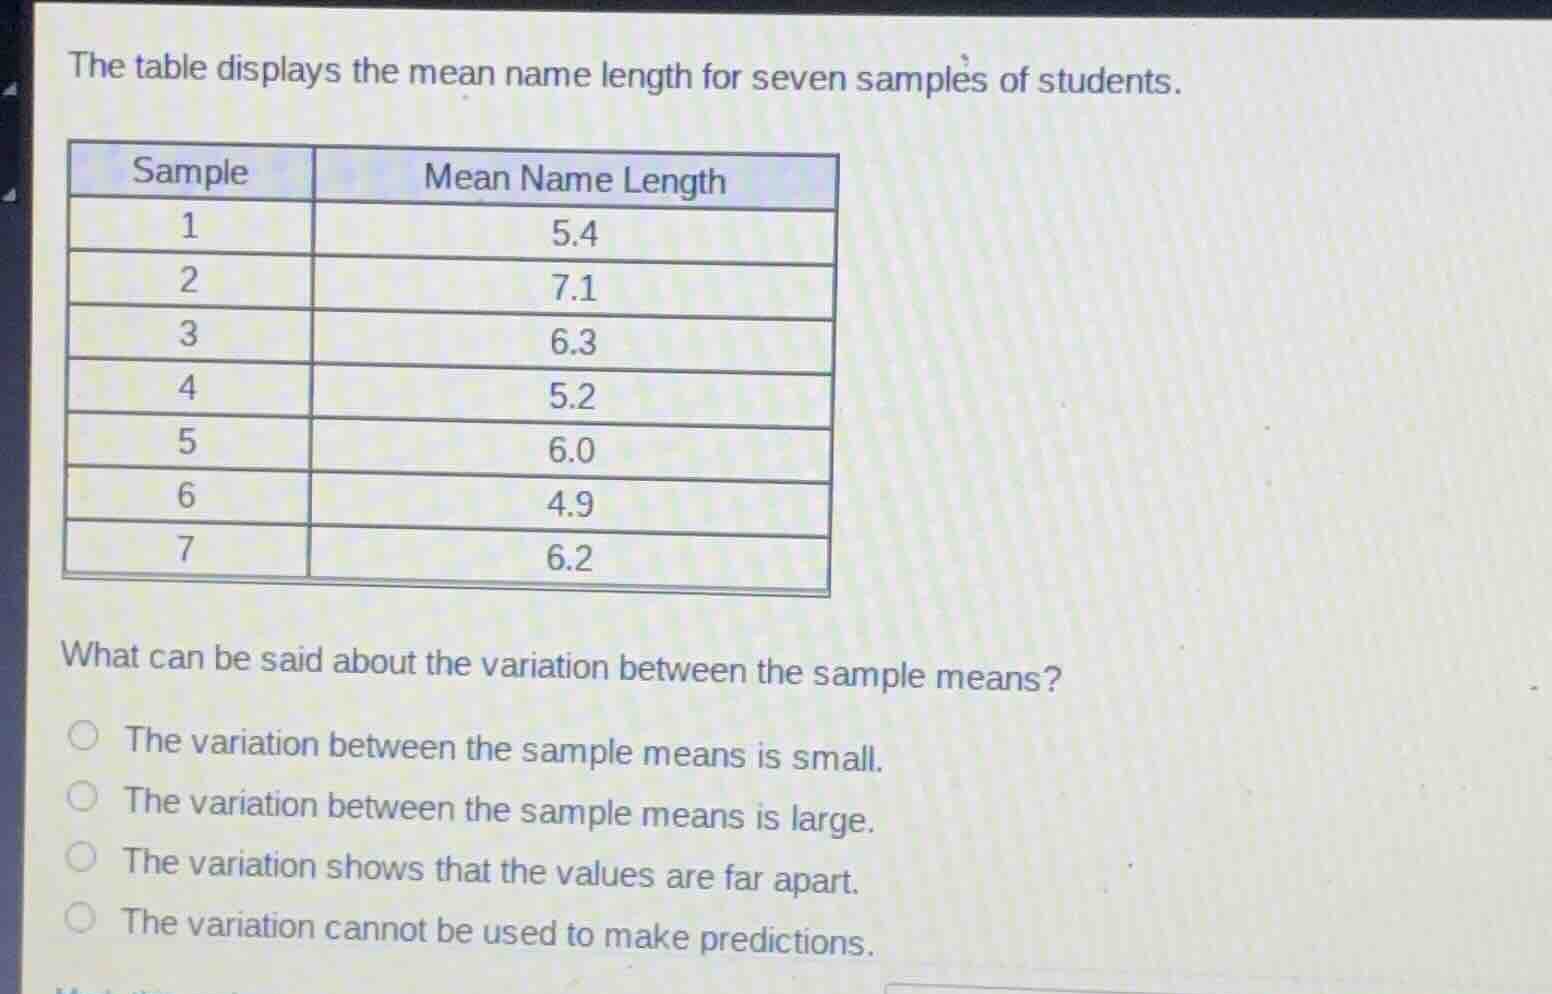
the table displays the mean name length for seven samples of students.
sample | mean name length
1 | 5.4
2 | 7.1
3 | 6.3
4 | 5.2
5 | 6.0
6 | 4.9
7 | 6.2
what can be said about the variation between the sample means?
- the variation between the sample means is small.
- the variation between the sample means is large.
- the variation shows that the values are far apart.
- the variation cannot be used to make predictions.
Step1: Find range of sample means
First, identify the maximum and minimum values. Max = 7.1, Min = 4.9.
Range = $7.1 - 4.9 = 2.2$
Step2: Analyze the range size
Compare the range to the mean values (average of means: $\frac{5.4+7.1+6.3+5.2+6.0+4.9+6.2}{7} = \frac{41.1}{7} \approx 5.87$). A range of 2.2 relative to an average of ~5.87 is small.
Step3: Evaluate options
Eliminate incorrect options: "large variation" and "values far apart" are false. Variation can help predict population mean, so the last option is false.

Snap & solve any problem in the app
Get step-by-step solutions on Sovi AI
Photo-based solutions with guided steps
Explore more problems and detailed explanations
The variation between the sample means is small.