QUESTION IMAGE
Question
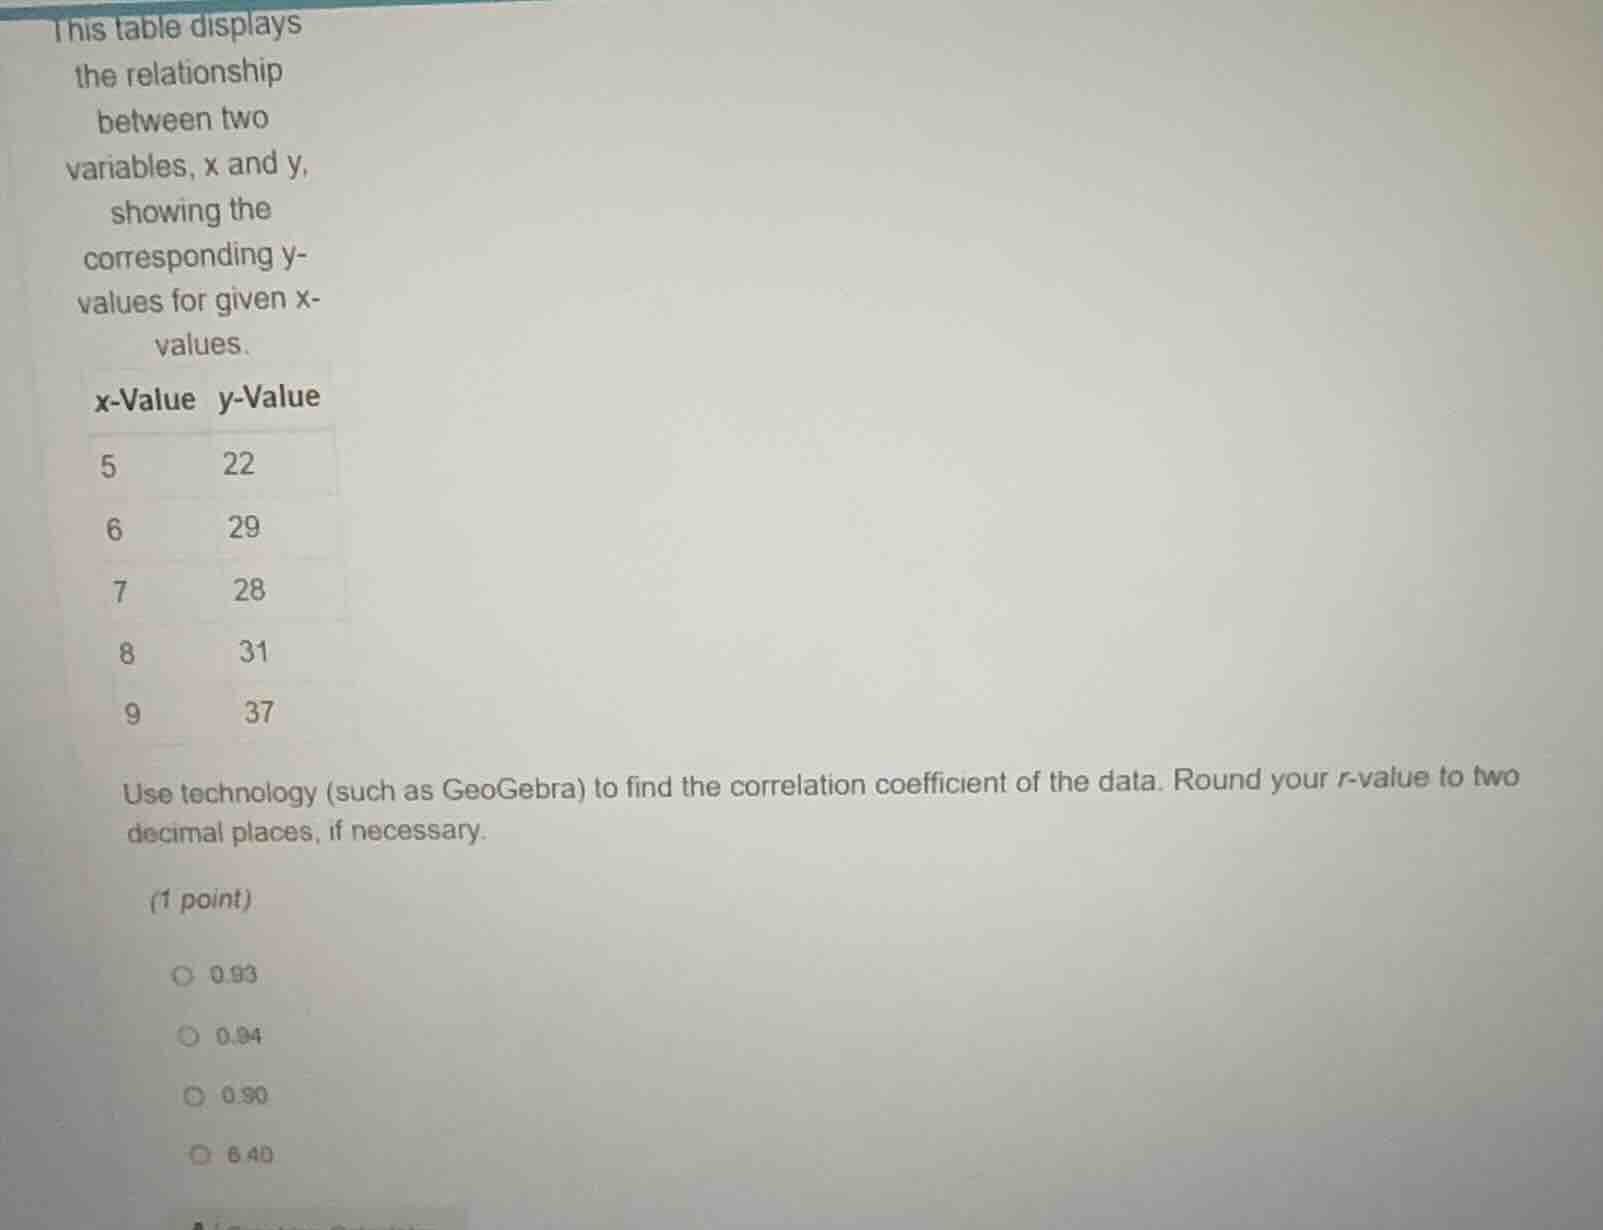
this table displays
the relationship
between two
variables, x and y,
showing the
corresponding y-
values for given x-
values.
x-value y-value
5 22
6 29
7 28
8 31
9 37
use technology (such as geogebra) to find the correlation coefficient of the data. round your r - value to two
decimal places, if necessary.
(1 point)
○ 0.93
○ 0.94
○ 0.90
○ 6.40
Step1: List data pairs
$(5,22), (6,29), (7,28), (8,31), (9,37)$
Step2: Calculate correlation coefficient
Using technology (e.g., GeoGebra) to compute the Pearson correlation coefficient $r$ for the paired data.
Step3: Round to two decimals
The calculated $r$ rounds to 0.94.

Snap & solve any problem in the app
Get step-by-step solutions on Sovi AI
Photo-based solutions with guided steps
Explore more problems and detailed explanations
B. 0.94