QUESTION IMAGE
Question
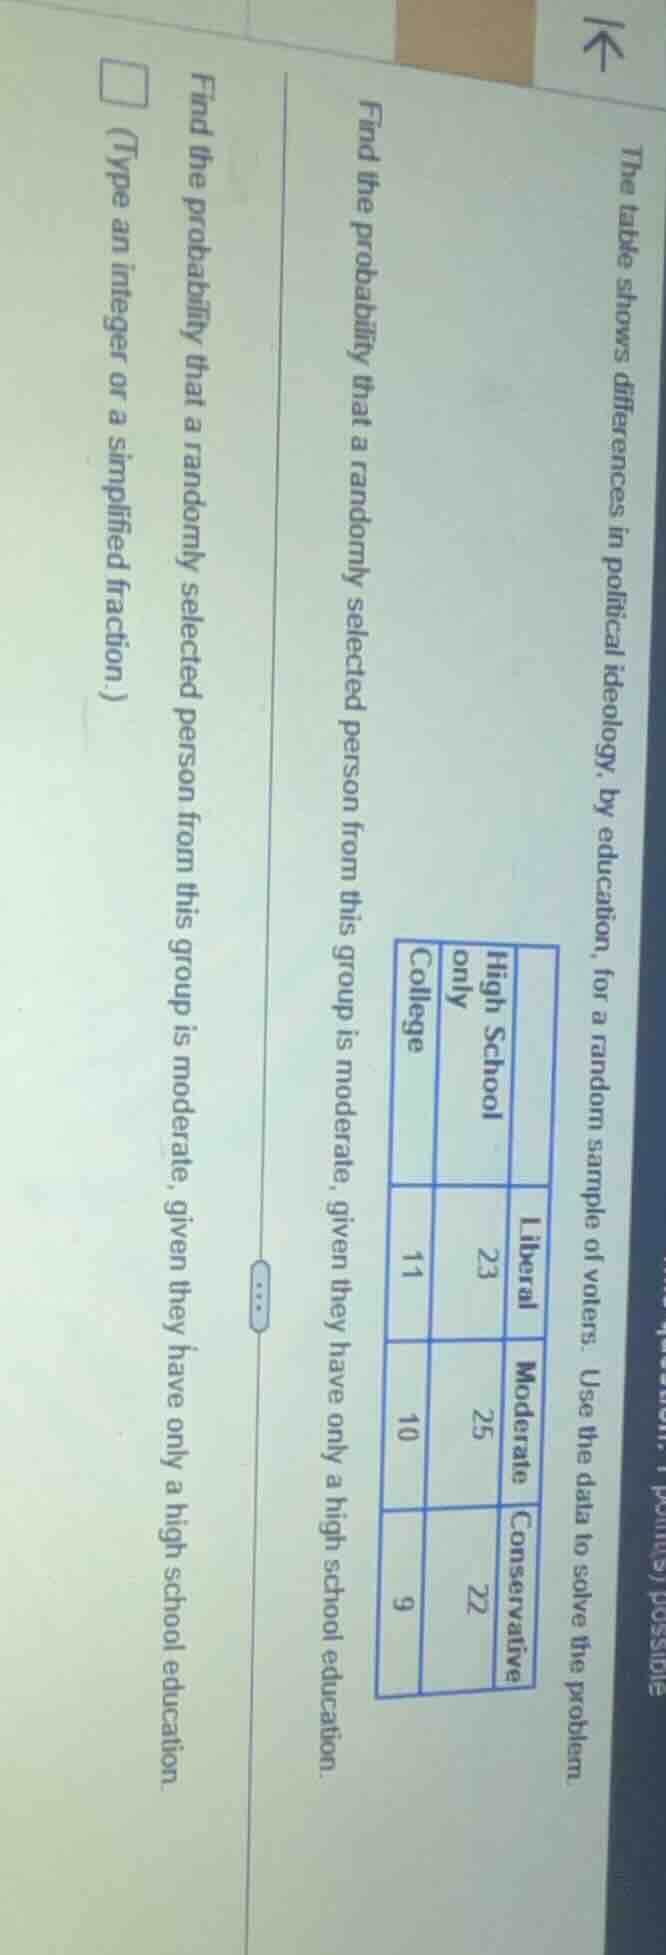
the table shows differences in political ideology, by education, for a random sample of voters. use the data to solve the problem.
| high school only | college | |
|---|---|---|
| moderate | 25 | 10 |
| conservative | 22 | 9 |
find the probability that a randomly selected person from this group is moderate, given they have only a high school education.
find the probability that a randomly selected person from this group is moderate, given they have only a high school education.
( type an integer or a simplified fraction. )
Step1: Calculate total high school respondents
Add the counts for liberal, moderate, and conservative high school-only voters.
$23 + 25 + 22 = 70$
Step2: Identify moderate high school respondents
Extract the count of moderate high school-only voters from the table.
$\text{Count} = 25$
Step3: Compute conditional probability
Divide the number of moderate high school-only voters by the total number of high school-only voters, then simplify the fraction.
$\frac{25}{70} = \frac{5}{14}$

Snap & solve any problem in the app
Get step-by-step solutions on Sovi AI
Photo-based solutions with guided steps
Explore more problems and detailed explanations
$\frac{5}{14}$