QUESTION IMAGE
Question
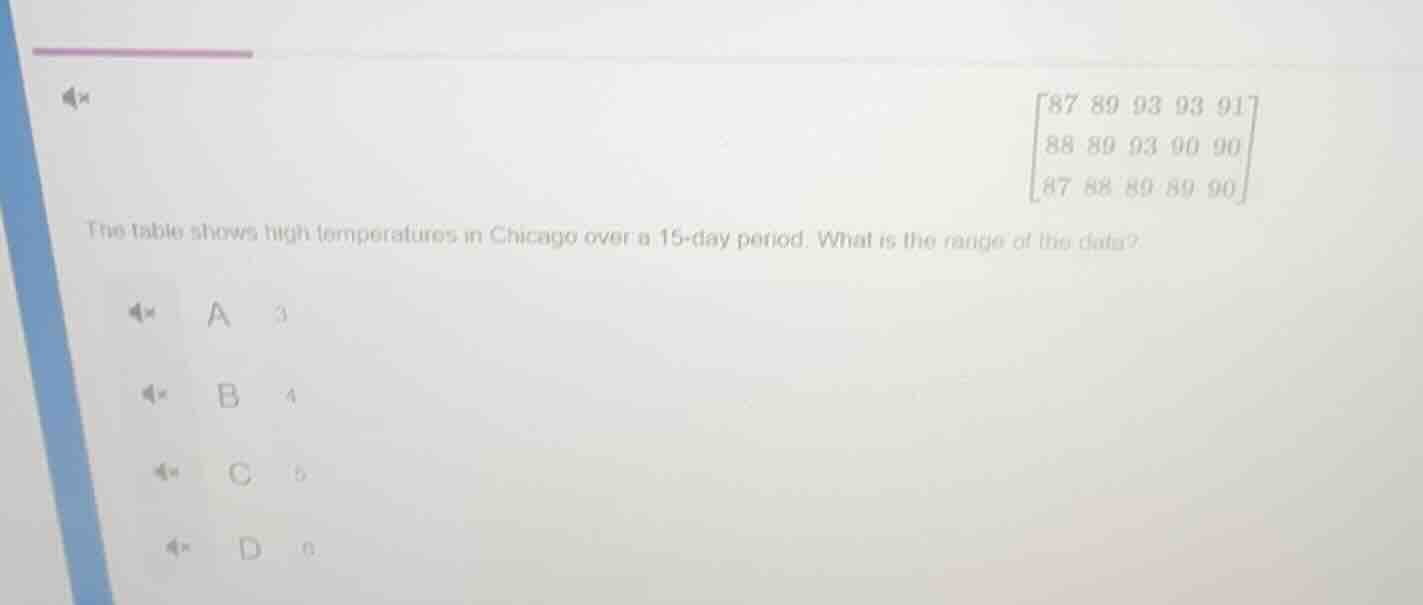
the table shows high temperatures in chicago over a 15 - day period. what is the range of this data?
a
b
c
d
Step1: Identify max and min values
Max value = 93, Min value = 80
Step2: Calculate data range
Range = Max - Min = $93 - 80$

Snap & solve any problem in the app
Get step-by-step solutions on Sovi AI
Photo-based solutions with guided steps
Explore more problems and detailed explanations
D. 13
(Note: Assuming option D is 13, as the visible text is cut off, and the calculated range of the provided temperature data is 13)