QUESTION IMAGE
Question
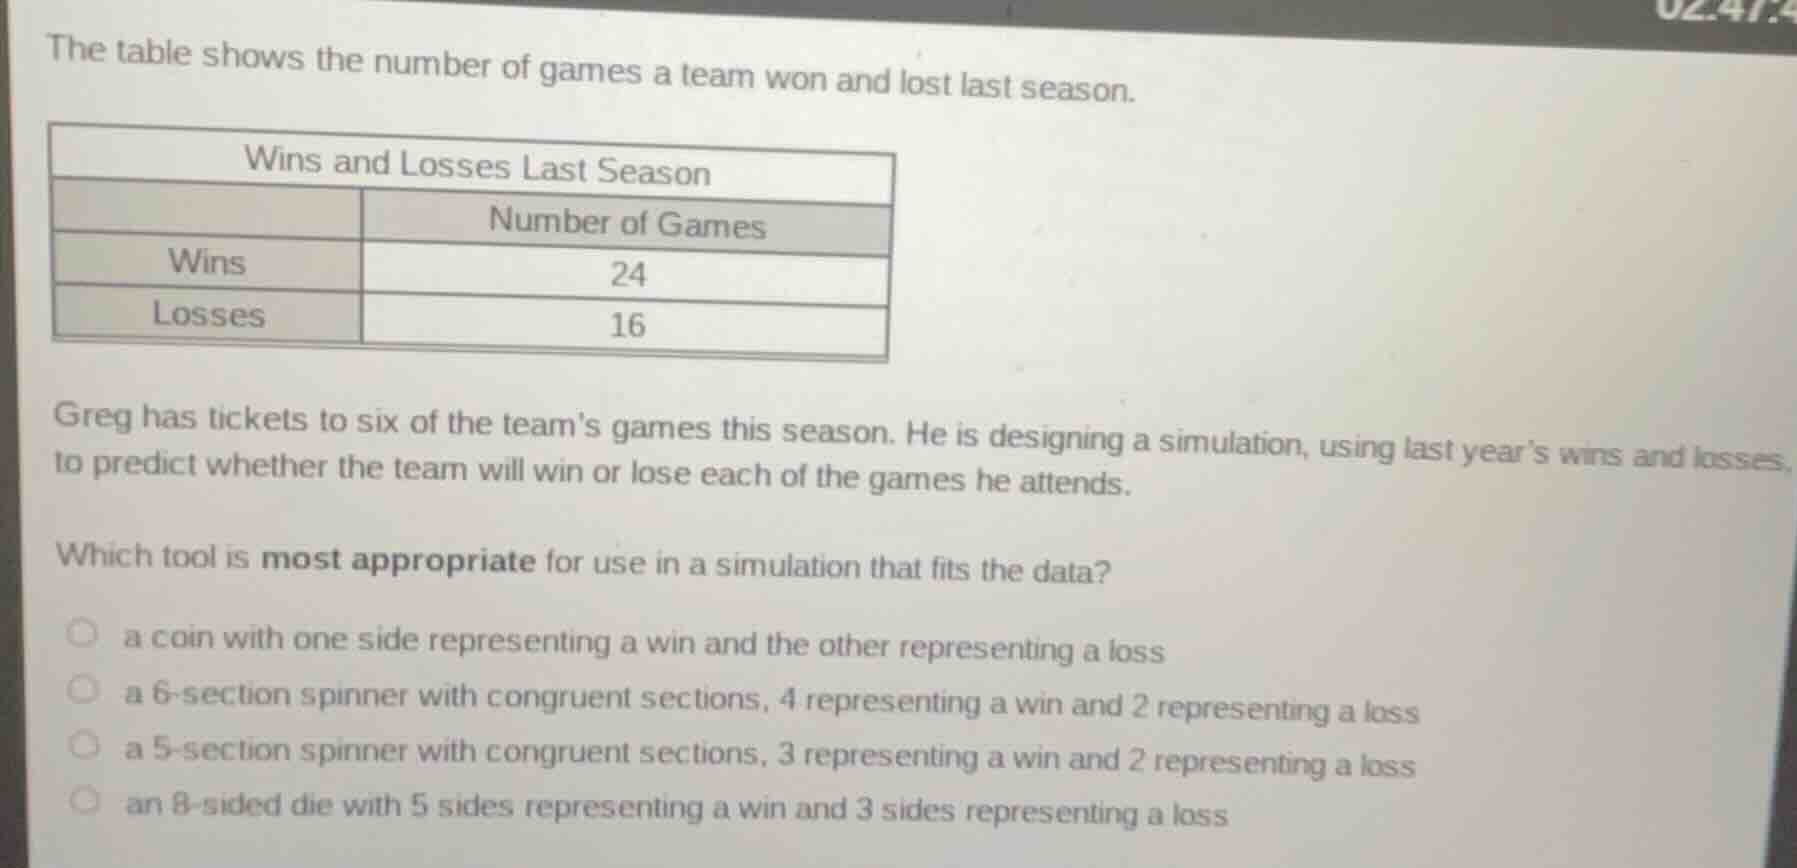
the table shows the number of games a team won and lost last season.
wins and losses last season
| number of games | |
| wins | 24 |
| losses | 16 |
greg has tickets to six of the teams games this season. he is designing a simulation, using last years wins and losses, to predict whether the team will win or lose each of the games he attends.
which tool is most appropriate for use in a simulation that fits the data?
- a coin with one side representing a win and the other representing a loss
- a 6 - section spinner with congruent sections, 4 representing a win and 2 representing a loss
- a 5 - section spinner with congruent sections, 3 representing a win and 2 representing a loss
- an 8 - sided die with 5 sides representing a win and 3 sides representing a loss
Step1: Calculate total games
$24 + 16 = 40$
Step2: Find win/loss ratio
Wins: $\frac{24}{40} = \frac{3}{5}$, Losses: $\frac{16}{40} = \frac{2}{5}$
Step3: Match ratio to options
Check which tool has a 3:2 win-loss split.

Snap & solve any problem in the app
Get step-by-step solutions on Sovi AI
Photo-based solutions with guided steps
Explore more problems and detailed explanations
a 5-section spinner with congruent sections, 3 representing a win and 2 representing a loss