QUESTION IMAGE
Question
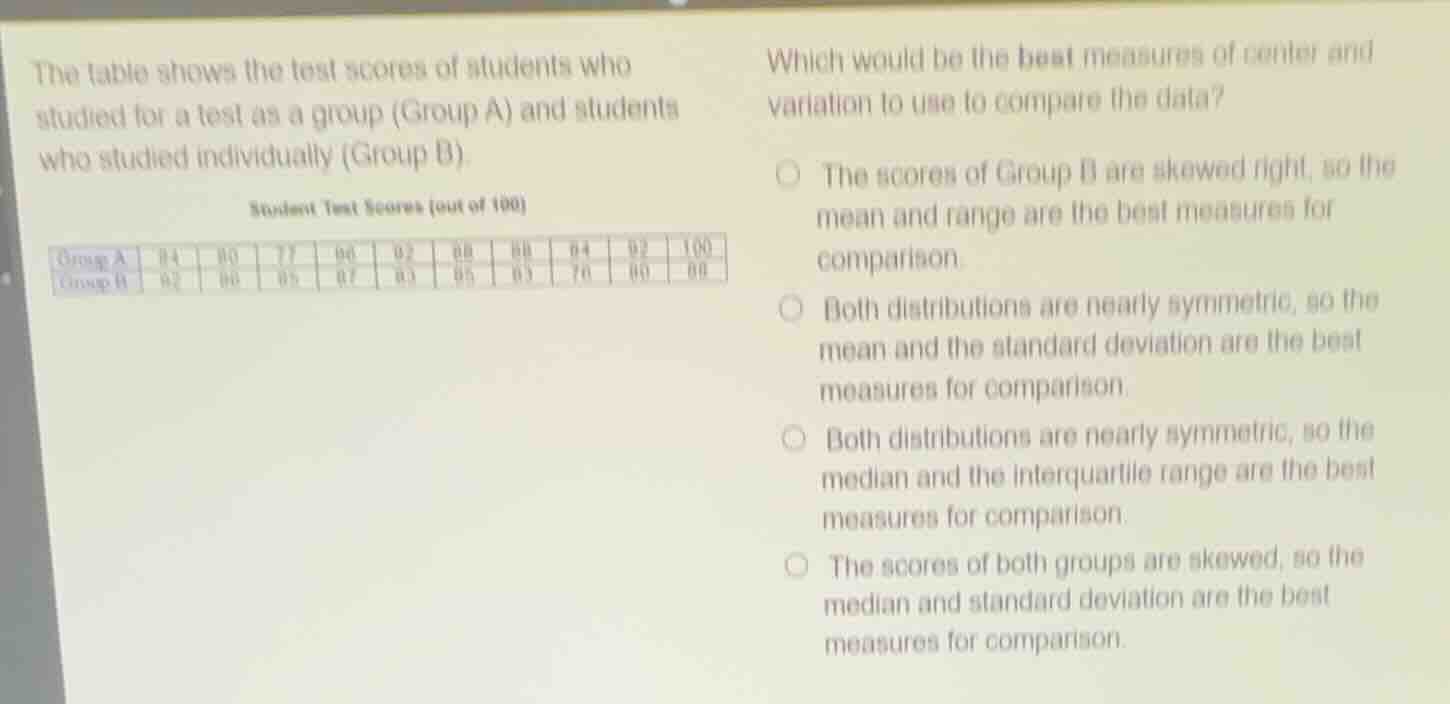
the table shows the test scores of students who studied for a test as a group (group a) and students who studied individually (group b).
student test scores (out of 100)
group a: 84, 80, 77, 96, 92, 88, 88, 84, 92, 100
group b: 82, 90, 95, 87, 83, 85, 83, 76, 60, 89
which would be the best measures of center and variation to use to compare the data?
- the scores of group b are skewed right, so the mean and range are the best measures for comparison.
- both distributions are nearly symmetric, so the mean and the standard deviation are the best measures for comparison.
- both distributions are nearly symmetric, so the median and the interquartile range are the best measures for comparison.
- the scores of both groups are skewed, so the median and standard deviation are the best measures for comparison.
To determine the best measures of center and variation, we analyze the distribution of the data. For symmetric distributions (where the data is evenly spread around the center), the mean (a measure of center) and standard deviation (a measure of variation) are appropriate because they are affected by the symmetry and work well with normally - distributed (or nearly symmetric) data. If the data is skewed, median and inter - quartile range (IQR) are better as they are resistant to outliers.
Looking at the data for Group A and Group B:
- For Group A: Let's order the data: 77, 80, 82, 84, 84, 86, 88, 92, 96, 100. The data seems to be symmetric around the middle values.
- For Group B: Ordering the data: 60, 69, 76, 82, 83, 83, 85, 87, 90, 95. This data also appears to be nearly symmetric.
Since both distributions are nearly symmetric, the mean (to measure the center) and standard deviation (to measure the variation) are the best measures for comparison.
The first option is incorrect because Group B's scores are not skewed right (the ordered data shows a relatively symmetric pattern) and range is not a good measure of variation for symmetric data (it is affected by outliers). The third option is incorrect because we use mean and standard deviation for symmetric data, not median and IQR. The fourth option is incorrect as the data is not skewed.

Snap & solve any problem in the app
Get step-by-step solutions on Sovi AI
Photo-based solutions with guided steps
Explore more problems and detailed explanations
B. Both distributions are nearly symmetric, so the mean and the standard deviation are the best measures for comparison.