QUESTION IMAGE
Question
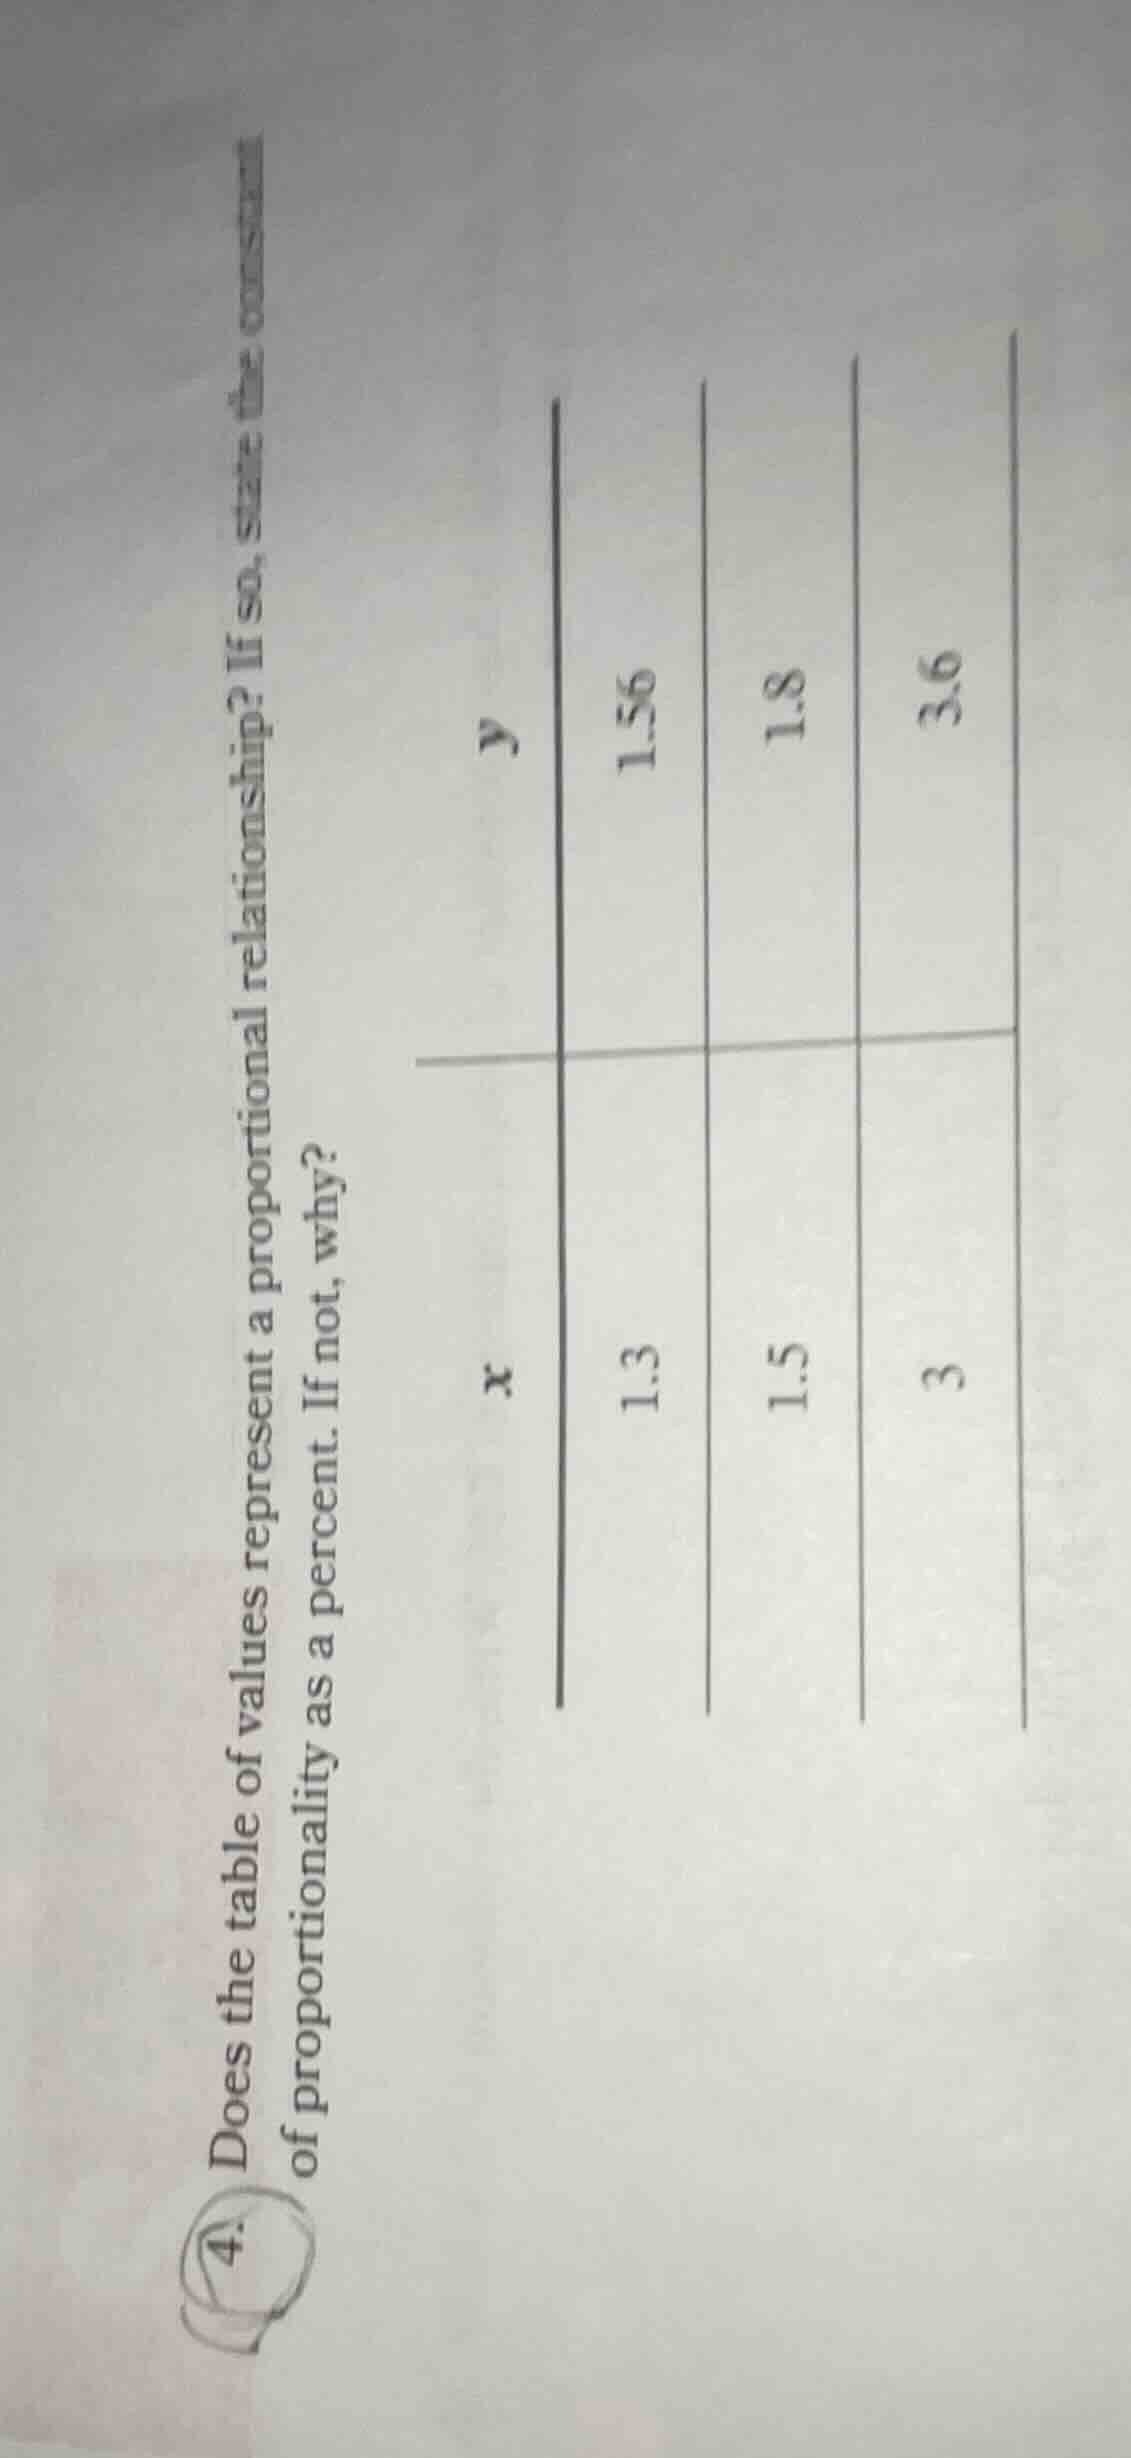
does the table of values represent a proportional relationship? if so, state the constant of proportionality as a percent. if not, why?
x | 1.3 | 1.5 | 3
y | 1.56 | 1.8 | 3.6
Step1: Calculate $\frac{y}{x}$ for first pair
$\frac{1.56}{1.3} = 1.2$
Step2: Calculate $\frac{y}{x}$ for second pair
$\frac{1.8}{1.5} = 1.2$
Step3: Calculate $\frac{y}{x}$ for third pair
$\frac{3.6}{3} = 1.2$
Step4: Check for constant ratio
All $\frac{y}{x}$ ratios equal 1.2.

Snap & solve any problem in the app
Get step-by-step solutions on Sovi AI
Photo-based solutions with guided steps
Explore more problems and detailed explanations
Yes, the table represents a proportional relationship. The constant of proportionality is 120% (or 1.2 as a decimal, 120% as a percent). This is because the ratio $\frac{y}{x}$ is identical for all pairs of values in the table.