QUESTION IMAGE
Question
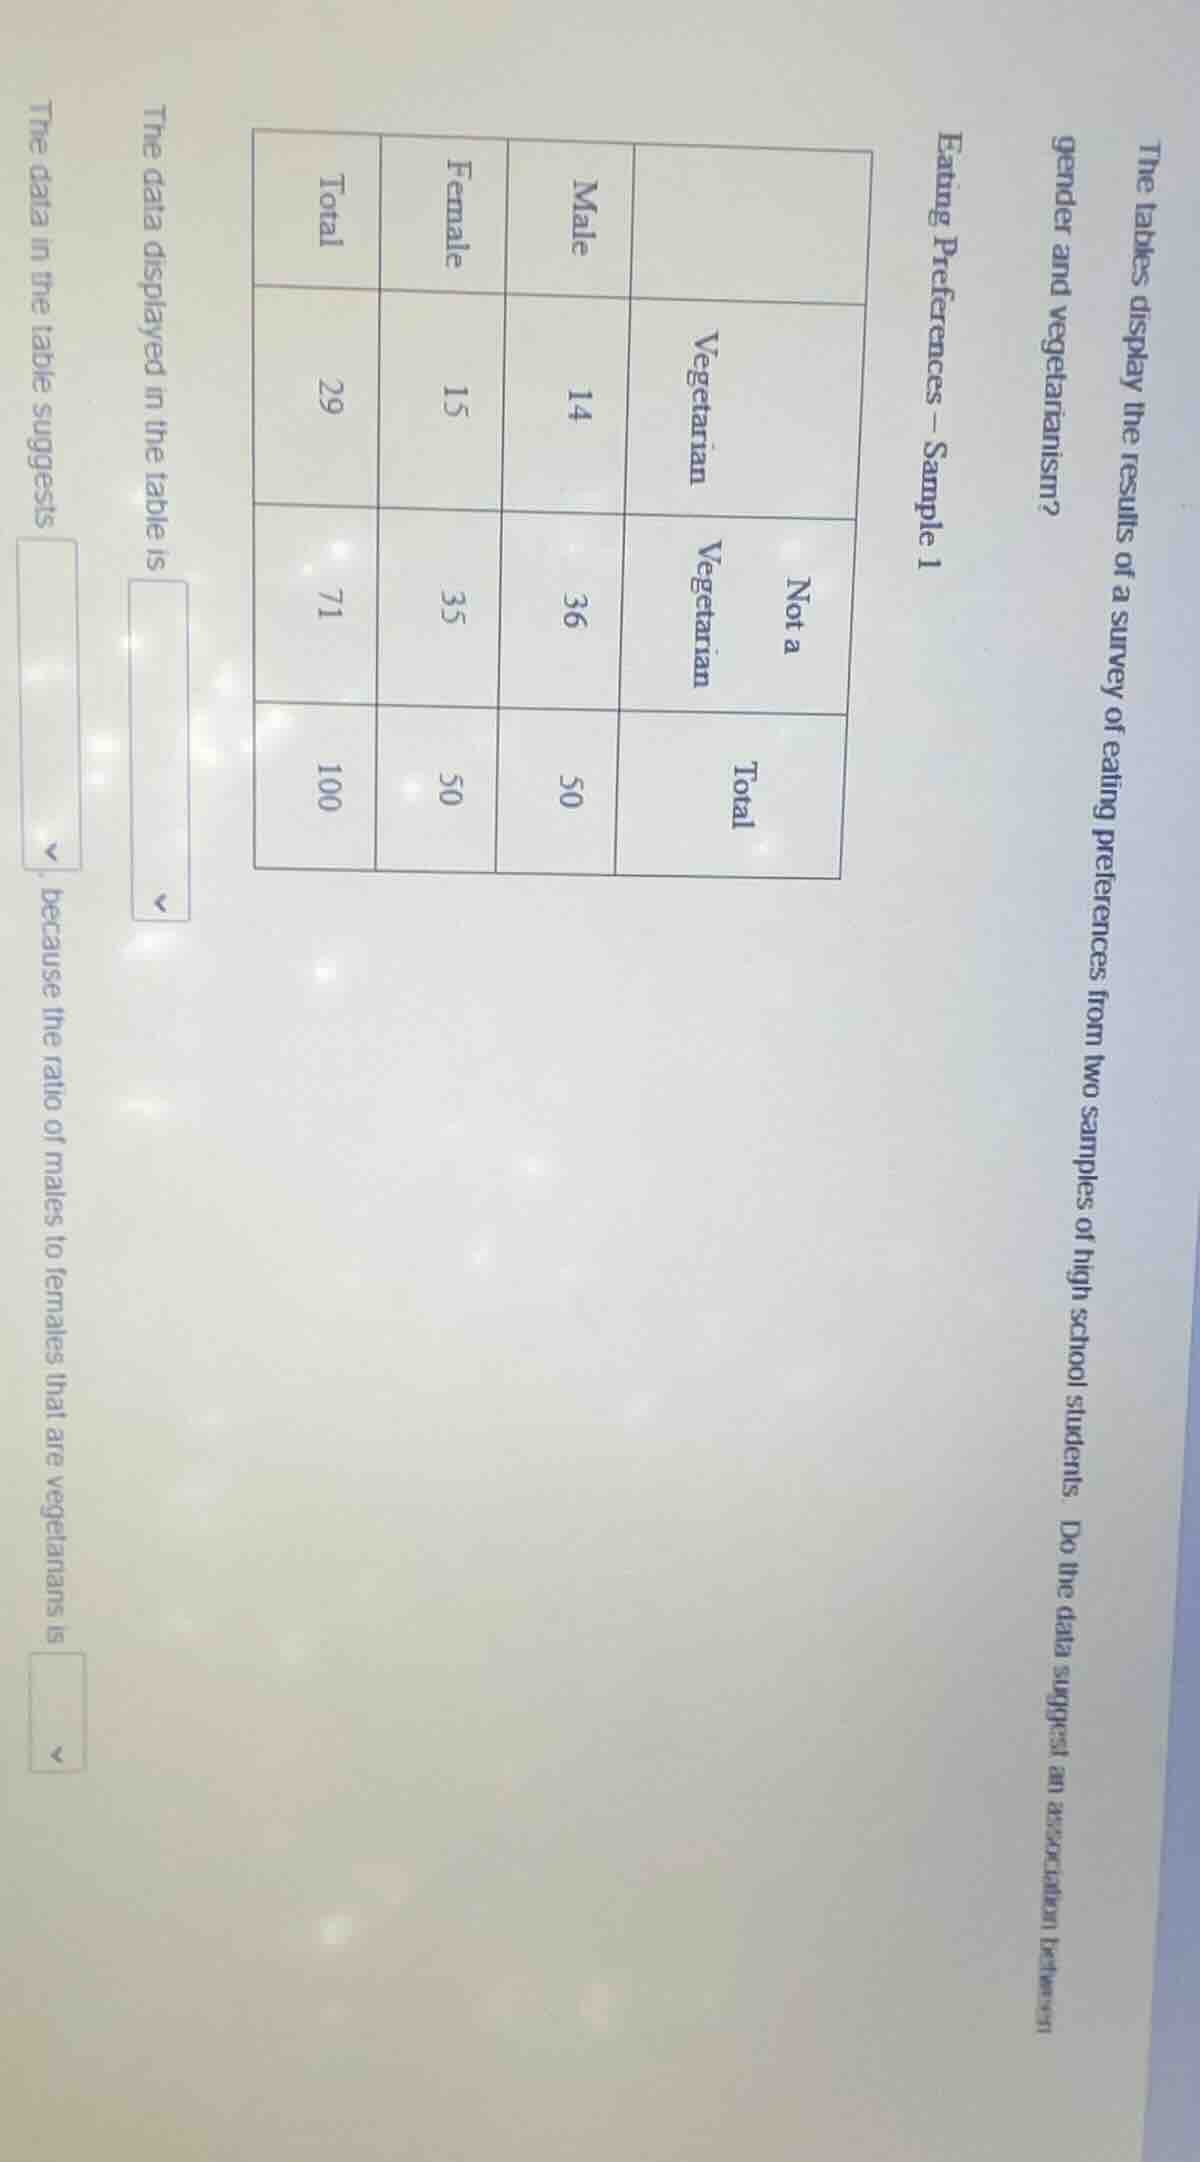
the tables display the results of a survey of eating preferences from two samples of high school students. do the data suggest an association between gender and vegetarianism?
eating preferences — sample 1
| male | female | total | |
|---|---|---|---|
| not a vegetarian | 36 | 35 | 71 |
| total | 50 | 50 | 100 |
the data displayed in the table is
the data in the table suggests , because the ratio of males to females that are vegetarians is
Step1: Determine if data is balanced
Check the total number of males and females. From the table, both Male and Female totals are 50. So the data is balanced (equal number of males and females).
Step2: Calculate ratio of male vegetarians to female vegetarians
Number of male vegetarians = 14, number of female vegetarians = 15. Ratio = $\frac{14}{15} \approx 0.933$, and the ratio of non - vegetarian males to non - vegetarian females: non - vegetarian males = 36, non - vegetarian females = 35, ratio = $\frac{36}{35}\approx1.029$. Since the ratio of male vegetarians to female vegetarians ($\frac{14}{15}$) is close to the ratio of male non - vegetarians to female non - vegetarians ($\frac{36}{35}$), and the total number of males and females is equal, the data suggests there is no association (or a weak association) between gender and vegetarianism. The ratio of males to females that are vegetarians is $\frac{14}{15}$ (males:females) or $\frac{14}{15}\approx0.93$ (male vegetarian ratio to female vegetarian ratio).

Snap & solve any problem in the app
Get step-by-step solutions on Sovi AI
Photo-based solutions with guided steps
Explore more problems and detailed explanations
The data displayed in the table is balanced (since number of males = number of females = 50). The data in the table suggests there is no strong association between gender and vegetarianism because the ratio of males to females that are vegetarians is $\frac{14}{15}$ (or approximately 0.93) and the ratio of non - vegetarian males to non - vegetarian females is close to this value.