QUESTION IMAGE
Question
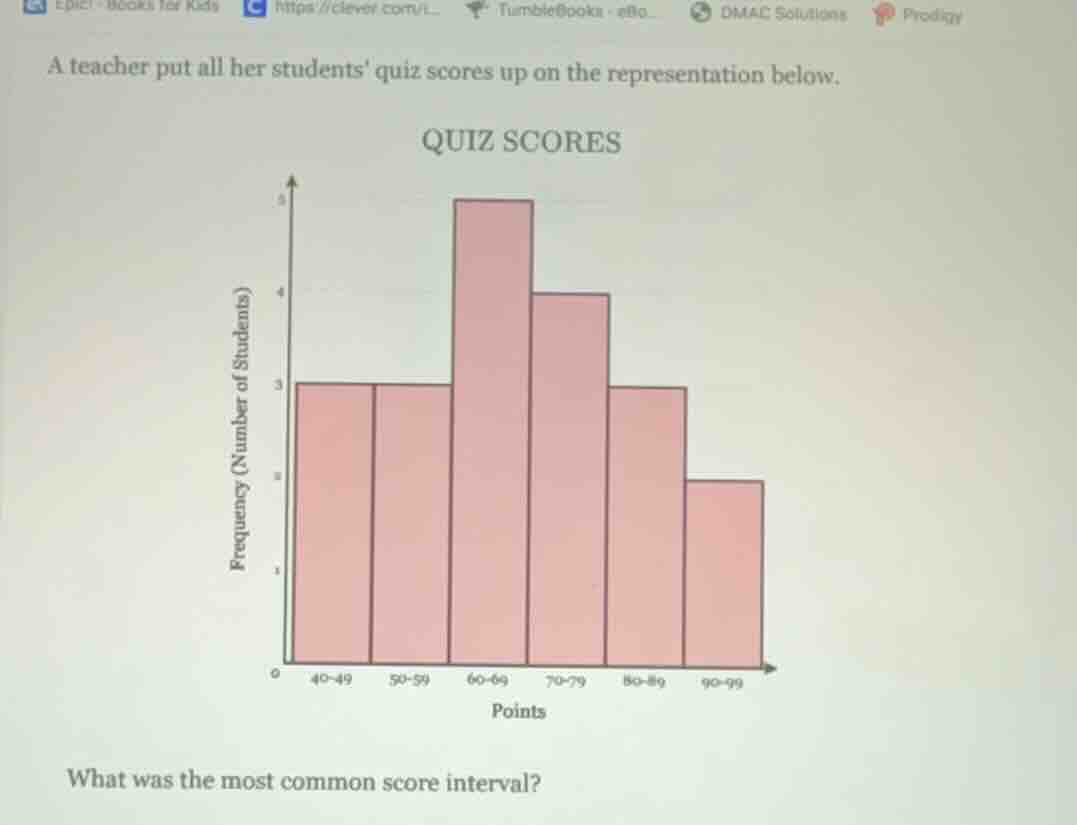
a teacher put all her students quiz scores up on the representation below.
quiz scores
bar graph with x - axis labeled points (intervals: 40 - 49, 50 - 59, 60 - 69, 70 - 79, 80 - 89, 90 - 99) and y - axis labeled frequency (number of students). heights of bars: 40 - 49: 3, 50 - 59: 3, 60 - 69: 5, 70 - 79: 4, 80 - 89: 3, 90 - 99: 2
what was the most common score interval?
Step1: Analyze the bar graph
The bar graph shows the frequency (number of students) for each score interval. We need to find the interval with the highest bar (maximum frequency).
Step2: Identify the tallest bar
Looking at the graph, the bar for the 60 - 69 score interval is the tallest, meaning it has the highest frequency (number of students).

Snap & solve any problem in the app
Get step-by-step solutions on Sovi AI
Photo-based solutions with guided steps
Explore more problems and detailed explanations
60 - 69