QUESTION IMAGE
Question
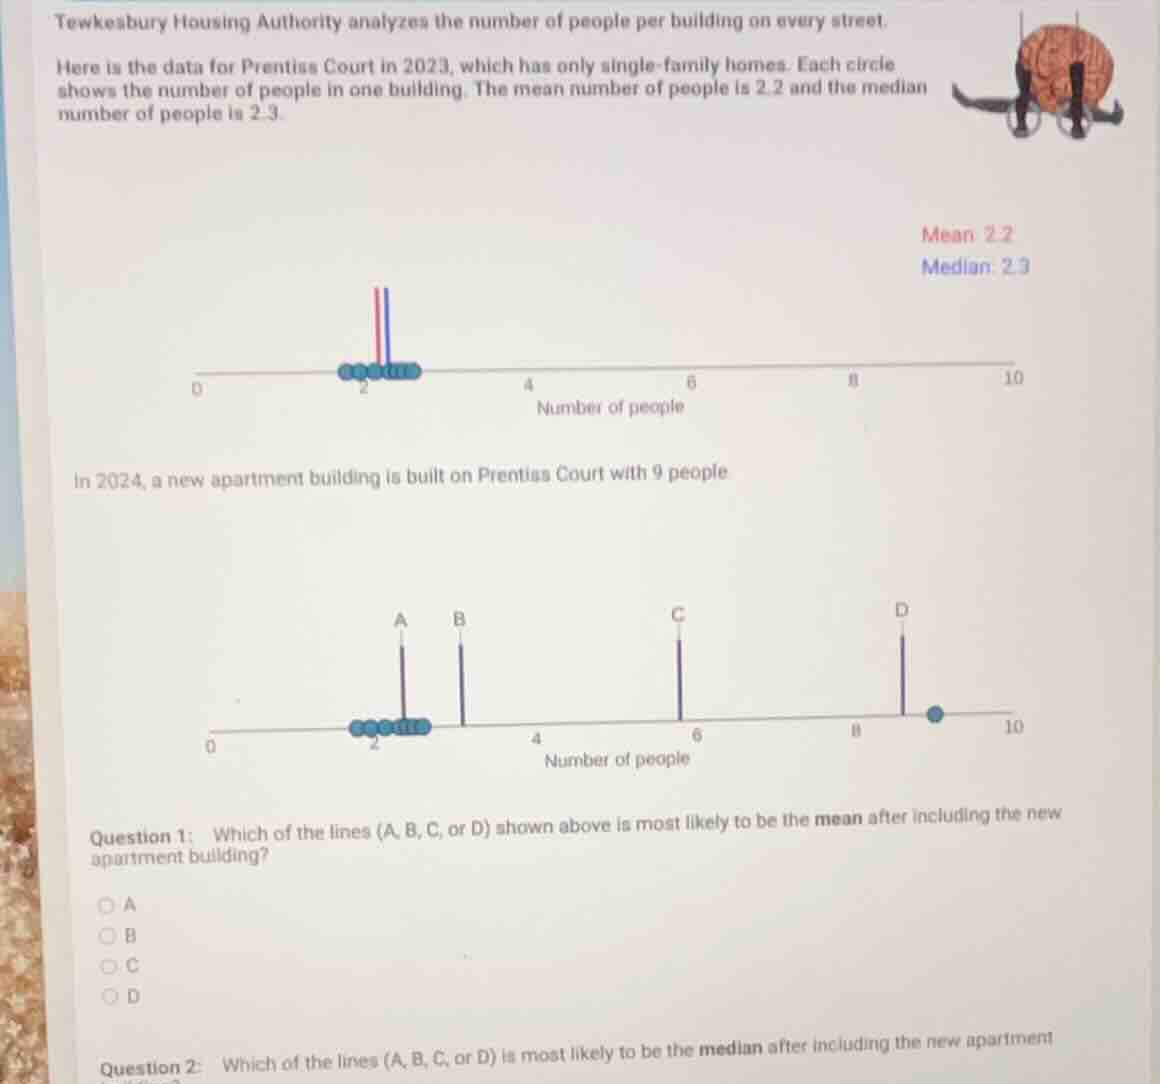
tewkesbury housing authority analyzes the number of people per building on every street. here is the data for prentiss court in 2023, which has only single - family homes. each circle shows the number of people in one building. the mean number of people is 2.2 and the median number of people is 2.3. mean 2.2 median: 2.3 0 4 6 8 10 number of people in 2024, a new apartment building is built on prentiss court with 9 people a b c d 0 4 6 8 10 number of people question 1: which of the lines (a, b, c, or d) shown above is most likely to be the mean after including the new apartment building? a b c d question 2: which of the lines (a, b, c, or d) is most likely to be the median after including the new apartment building
Step1: Find original total people
Let original number of buildings = $n$. Mean = $\frac{\text{Total people}}{n}=2.2$, so total people = $2.2n$.
Step2: Find new total and count
New total people = $2.2n + 9$, new count = $n+1$.
Step3: Calculate new mean
New mean = $\frac{2.2n + 9}{n+1} = \frac{2.2(n+1) + 9 - 2.2}{n+1} = 2.2 + \frac{6.8}{n+1}$.
From median=2.3, $n$ is odd, original data has most values at 2. Count $n$: median is $\frac{n+1}{2}$th value=2.3? No, median is 2.3, so $n=10$ (since median of 10 data: average of 5th and 6th, (2+2.6)/2=2.3? No, simpler: original mean 2.2, if $n=10$, total=22. New total=22+9=31, new mean=$\frac{31}{11}\approx2.82$, which is close to line B.
Step4: Find new median
Original $n$: median=2.3, so $n$ is even: average of $\frac{n}{2}$th and $(\frac{n}{2}+1)$th values=2.3. So one is 2, one is 2.6. When adding 9 (largest value), new count $n+1$ (odd). Median is $(\frac{n+1+1}{2})=(\frac{n}{2}+1)$th value, which is 2.3? No, original data: most values are 2, adding 9 shifts median to the next value, which is still ~2, close to line A.

Snap & solve any problem in the app
Get step-by-step solutions on Sovi AI
Photo-based solutions with guided steps
Explore more problems and detailed explanations
Question 1: B
Question 2: A