QUESTION IMAGE
Question
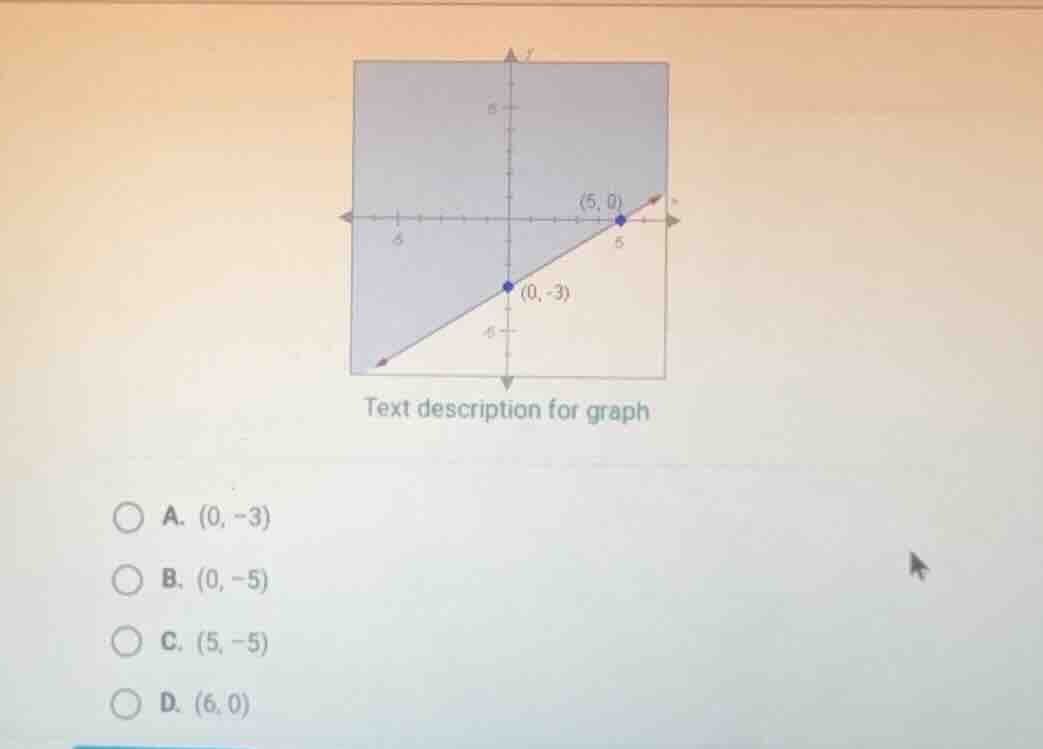
text description for graph
a. (0, -3)
b. (0, -5)
c. (5, -5)
d. (6, 0)
Brief Explanations
To determine which point lies in the shaded region, we analyze the graph. The shaded region is above the line passing through \((5, 0)\) and \((0, -3)\). Let's check each option:
- Option A: \((0, -3)\) is on the line, not in the shaded region (which is above the line). Wait, no—wait, looking at the graph, the shaded area is above the line. Wait, actually, let's re - evaluate. Wait, the line goes from \((5,0)\) to \((0, - 3)\). The equation of the line can be found using the slope - intercept form \(y=mx + b\). The slope \(m=\frac{y_2 - y_1}{x_2 - x_1}=\frac{-3 - 0}{0 - 5}=\frac{-3}{-5}=\frac{3}{5}\). So the equation is \(y=\frac{3}{5}x-3\).
- For point A \((0,-3)\): It's on the line.
- For point B \((0, - 5)\): Plug \(x = 0\) into the line equation, \(y=-3\). Since \(-5<-3\), this point is below the line, not in the shaded region.
- For point C \((5,-5)\): Plug \(x = 5\) into the line equation, \(y=\frac{3}{5}(5)-3=3 - 3=0\). Since \(-5 < 0\), no, wait, wait, maybe I got the direction wrong. Wait, the shaded region is the area above the line? Wait, the graph shows the shaded area is above the line. Wait, let's check the y - coordinate for point C. Wait, no, maybe I made a mistake. Wait, let's look at the graph again. The shaded area is the region that includes the top part. Wait, let's check the x and y values. Wait, the square has x from - 6 to 6 (approx) and y from - 6 to 6 (approx). The line goes from \((5,0)\) to \((0, - 3)\). Let's check the position of each point:
- Point A: \((0,-3)\) is on the line.
- Point B: \((0,-5)\) is below the line (since for \(x = 0\), the line is at \(y=-3\), and \(-5 < - 3\)).
- Point C: \((5,-5)\): Plug \(x = 5\) into the line equation, \(y = 0\). Since \(-5<0\), but wait, maybe the shaded region is above the line. Wait, no, maybe I messed up the direction. Wait, the slope is positive, going from \((0,-3)\) (lower on the y - axis when x = 0) to \((5,0)\) (higher on the y - axis when x = 5). So the line is increasing. The shaded region is above the line. Wait, for point C \((5,-5)\), the y - value of the line at \(x = 5\) is \(0\), and \(-5 < 0\), so it's below the line. Wait, maybe I made a mistake. Wait, let's check the other option. Wait, no, wait the options: Wait, maybe the shaded region is the area that is in the square and above the line. Wait, let's check point C: \((5,-5)\). Wait, the x - coordinate is 5, which is within the square (since the square goes to at least x = 5). The y - coordinate is - 5. Wait, the line at x = 5 is at y = 0. So - 5 is below 0. But maybe the shaded region is the area that is above the line. Wait, no, maybe I got the inequality wrong. Let's re - express the line equation. The line passes through \((5,0)\) and \((0,-3)\). The equation is \(3x-5y = 15\) (multiplying \(y=\frac{3}{5}x - 3\) by 5: \(5y=3x - 15\), so \(3x-5y=15\)). The inequality for the shaded region (above the line) would be \(3x - 5y\geq15\) (if the line is solid, but the line looks solid? Wait, the line is drawn with a solid line? Wait, the points on the line are part of the boundary? Wait, no, the original graph: the line is a boundary, and the shaded region is above it. Wait, let's test each point in the inequality \(3x-5y\geq15\):
- For A \((0,-3)\): \(3(0)-5(-3)=15\), so \(15\geq15\), which means it's on the line (satisfies the equality). But maybe the shaded region includes the area above the line, and the line is part of the boundary? Wait, no, maybe I made a mistake. Wait, looking at the graph again, the shaded area is the region that is above…

Snap & solve any problem in the app
Get step-by-step solutions on Sovi AI
Photo-based solutions with guided steps
Explore more problems and detailed explanations
C. (5, -5)