QUESTION IMAGE
Question
thursday
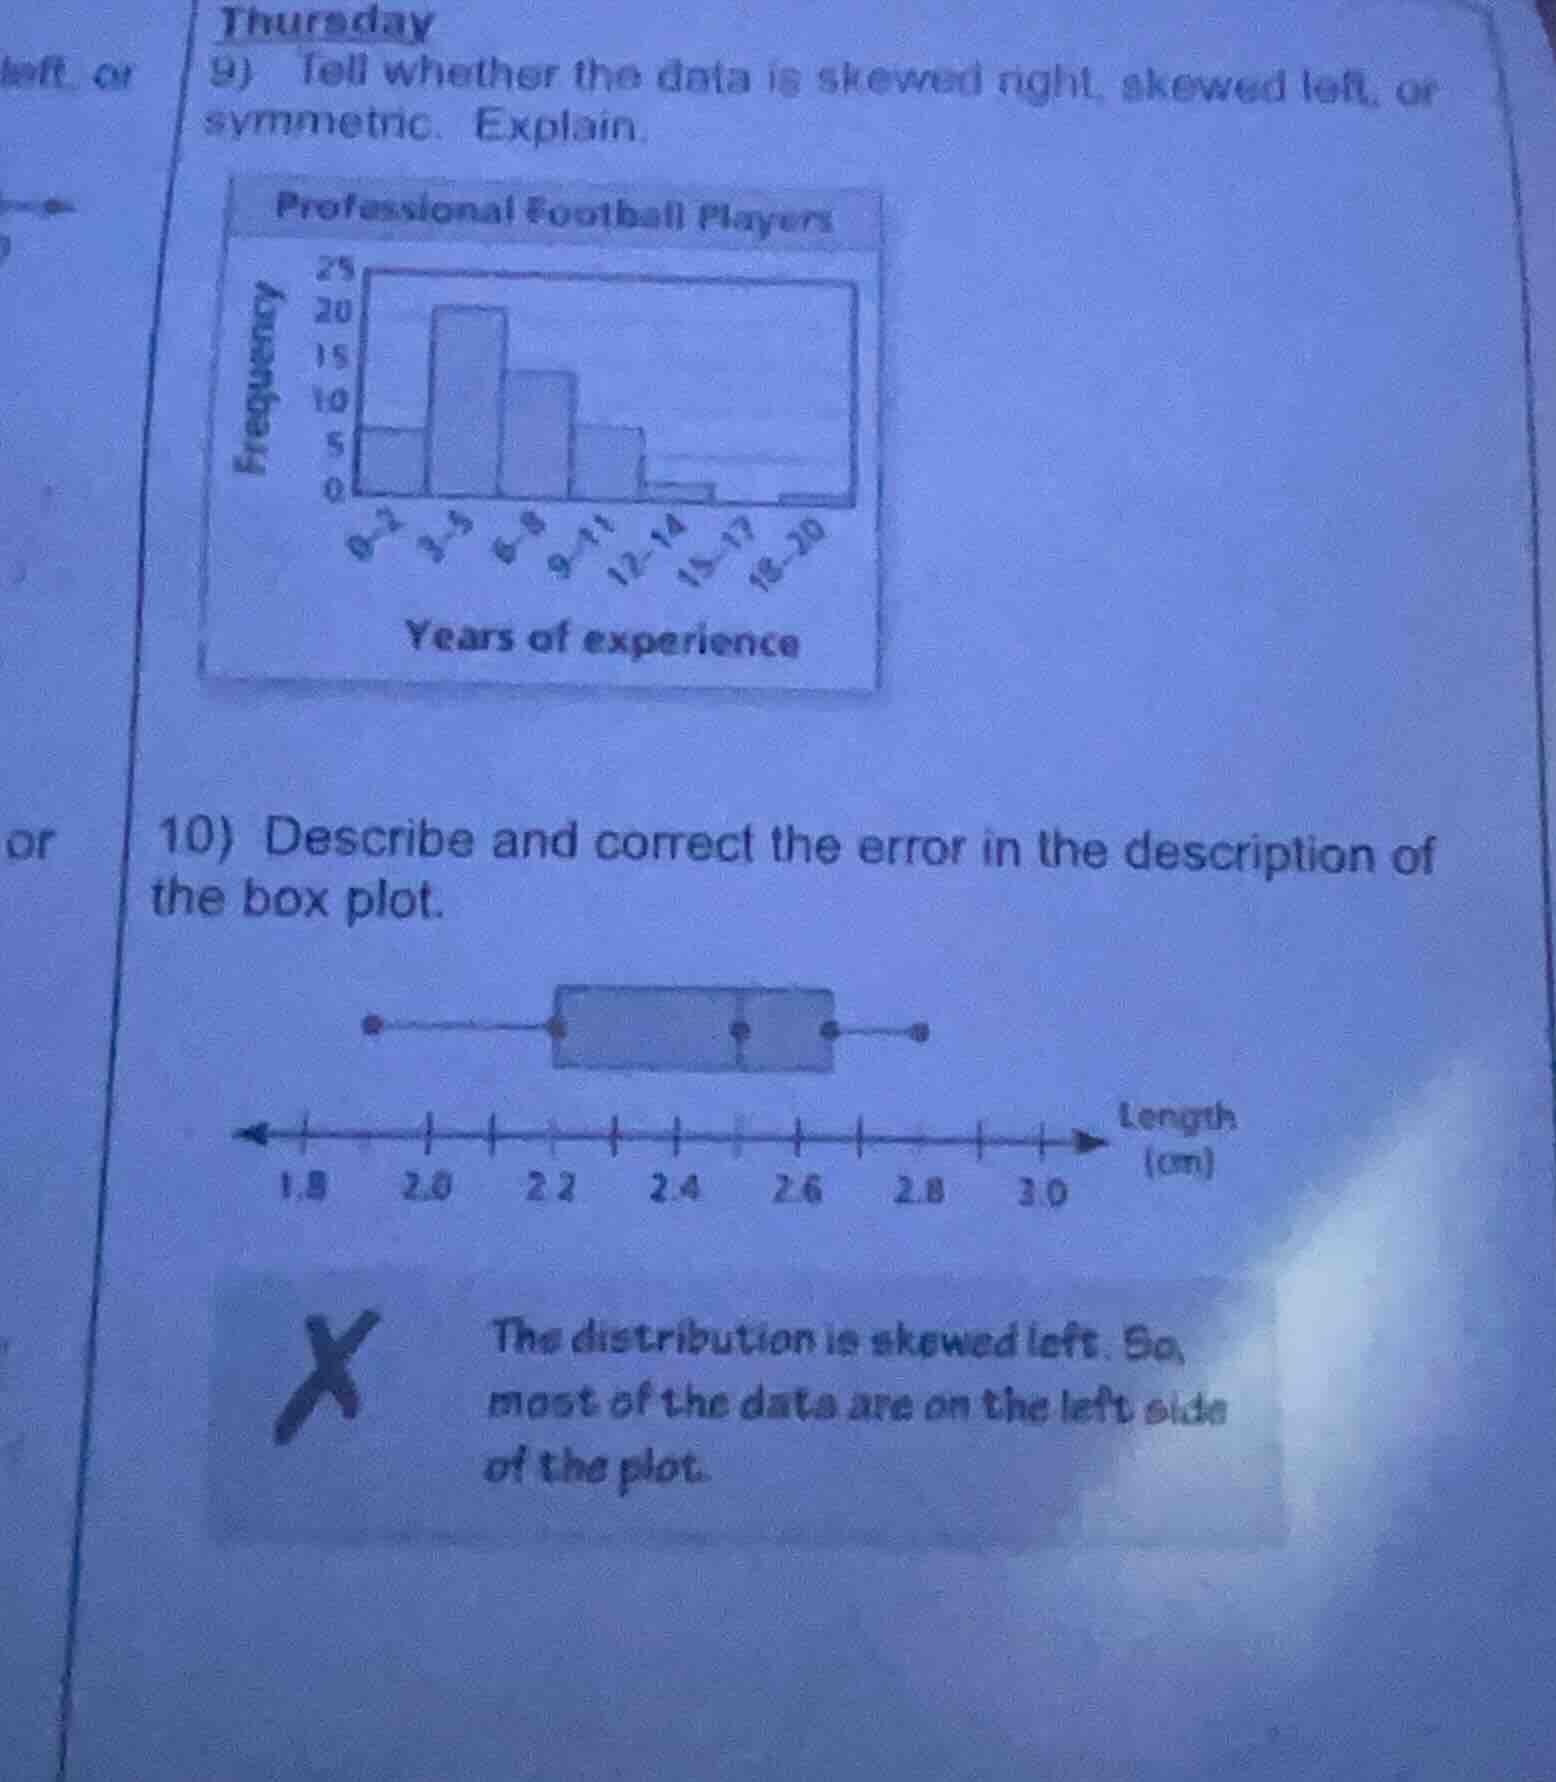
- tell whether the data is skewed right, skewed left, or symmetric. explain.
(there is a bar graph here, titled professional football players, with frequency on the y - axis and years of experience on the x - axis. the x - axis categories are 0 - 2, 3 - 5, 6 - 8, 9 - 11, 12 - 14, 15 - 17, 16 - 20. the y - axis has values 0, 5, 10, 15, 20, 25. the bar heights are: 0 - 2: around 5, 3 - 5: around 20, 6 - 8: around 13, 9 - 11: around 6, 12 - 14: around 1, 15 - 17: around 0, 16 - 20: around 0.5)
- describe and correct the error in the description of the box plot.
(there is a box - and - whisker plot here, with the x - axis labeled length (cm) and marked with 1.8, 2.0, 2.2, 2.4, 2.6, 2.8, 3.0. the box plot has a left whisker from around 1.8 to 2.2, a box from 2.2 to 2.7 (with a median line around 2.5), and a right whisker from 2.7 to 3.0. there is also a marked wrong description: \the distribution is skewed left. so, most of the data are on the left side of the plot.\)
Step1: Analyze histogram shape
The histogram has taller bars on the left (lower years of experience) and shorter bars extending to the right (higher years of experience).
Step2: Determine skewness
A distribution with a tail extending to the right is skewed right, meaning most data cluster on the left.
Step1: Identify box plot skewness
The box plot has a longer whisker on the right, indicating a right skew.
Step2: Correct the description
Right skew means most data are on the left, so the original claim of left skew is wrong.

Snap & solve any problem in the app
Get step-by-step solutions on Sovi AI
Photo-based solutions with guided steps
Explore more problems and detailed explanations
Skewed right; The distribution is skewed right, so most data are on the left side of the plot.