QUESTION IMAGE
Question
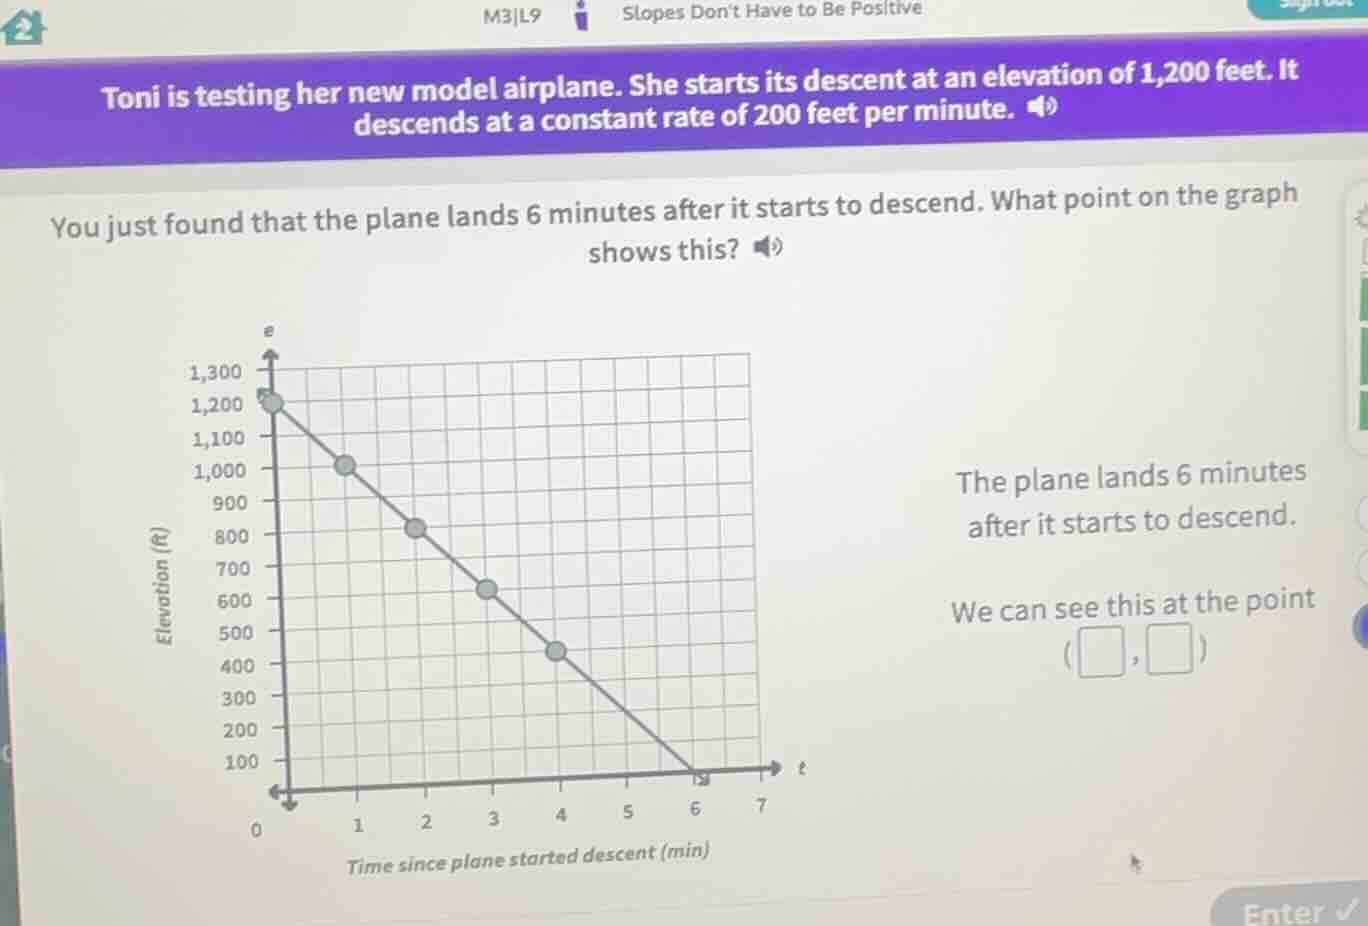
toni is testing her new model airplane. she starts its descent at an elevation of 1,200 feet. it descends at a constant rate of 200 feet per minute. you just found that the plane lands 6 minutes after it starts to descend. what point on the graph shows this? the plane lands 6 minutes after it starts to descend. we can see this at the point (\square, \square)
Step1: Identify independent variable
The independent variable is time (minutes since descent started), which is the $t$-axis (horizontal axis). When the plane lands, this value is 6 minutes.
Step2: Identify dependent variable
The dependent variable is elevation (feet), which is the $R$-axis (vertical axis). When the plane lands, its elevation is 0 feet.
Step3: Form the coordinate point
Graph points are written as (independent variable value, dependent variable value).

Snap & solve any problem in the app
Get step-by-step solutions on Sovi AI
Photo-based solutions with guided steps
Explore more problems and detailed explanations
$(6, 0)$