QUESTION IMAGE
Question
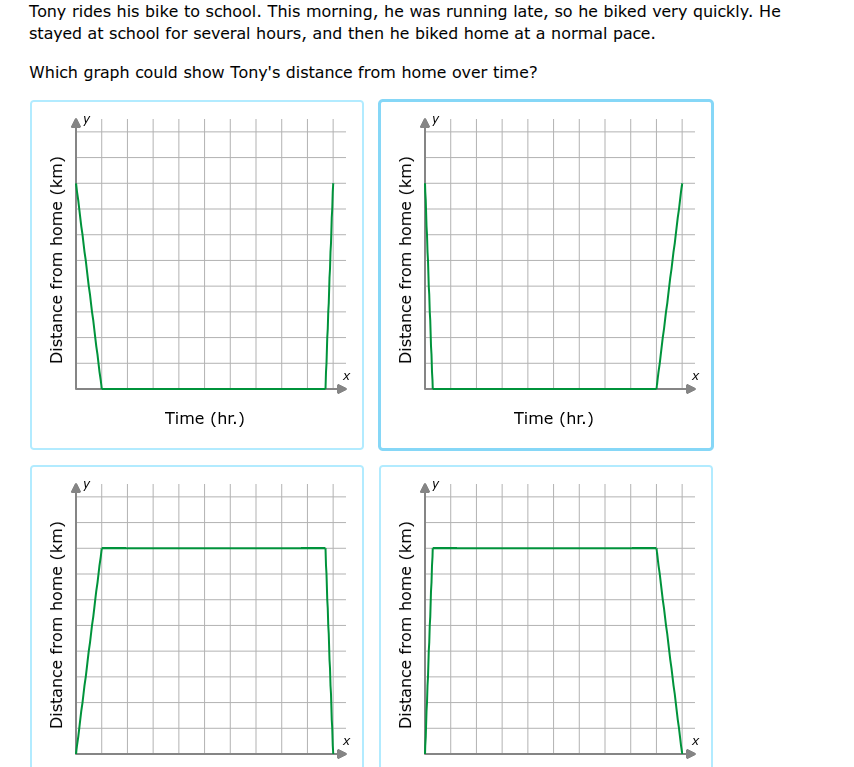
tony rides his bike to school. this morning, he was running late, so he biked very quickly. he stayed at school for several hours, and then he biked home at a normal pace. which graph could show tonys distance from home over time?
Step1: Analyze trip to school
Tony bikes quickly to school, so distance from home increases steeply over a short time (steep positive slope).
Step2: Analyze school stay
At school, distance from home does not change over time (flat horizontal line, slope = 0).
Step3: Analyze trip home
Tony bikes home at normal pace, which is slower than the morning trip. So distance from home decreases with a less steep negative slope (gentler than the initial upward slope).
Step4: Match to graph
Only the bottom-right graph has a steep positive slope, flat segment, and a less steep negative slope, matching Tony's journey.

Snap & solve any problem in the app
Get step-by-step solutions on Sovi AI
Photo-based solutions with guided steps
Explore more problems and detailed explanations
Bottom-right graph (the one with a steep upward line, flat horizontal segment, and a less steep downward line)