QUESTION IMAGE
Question
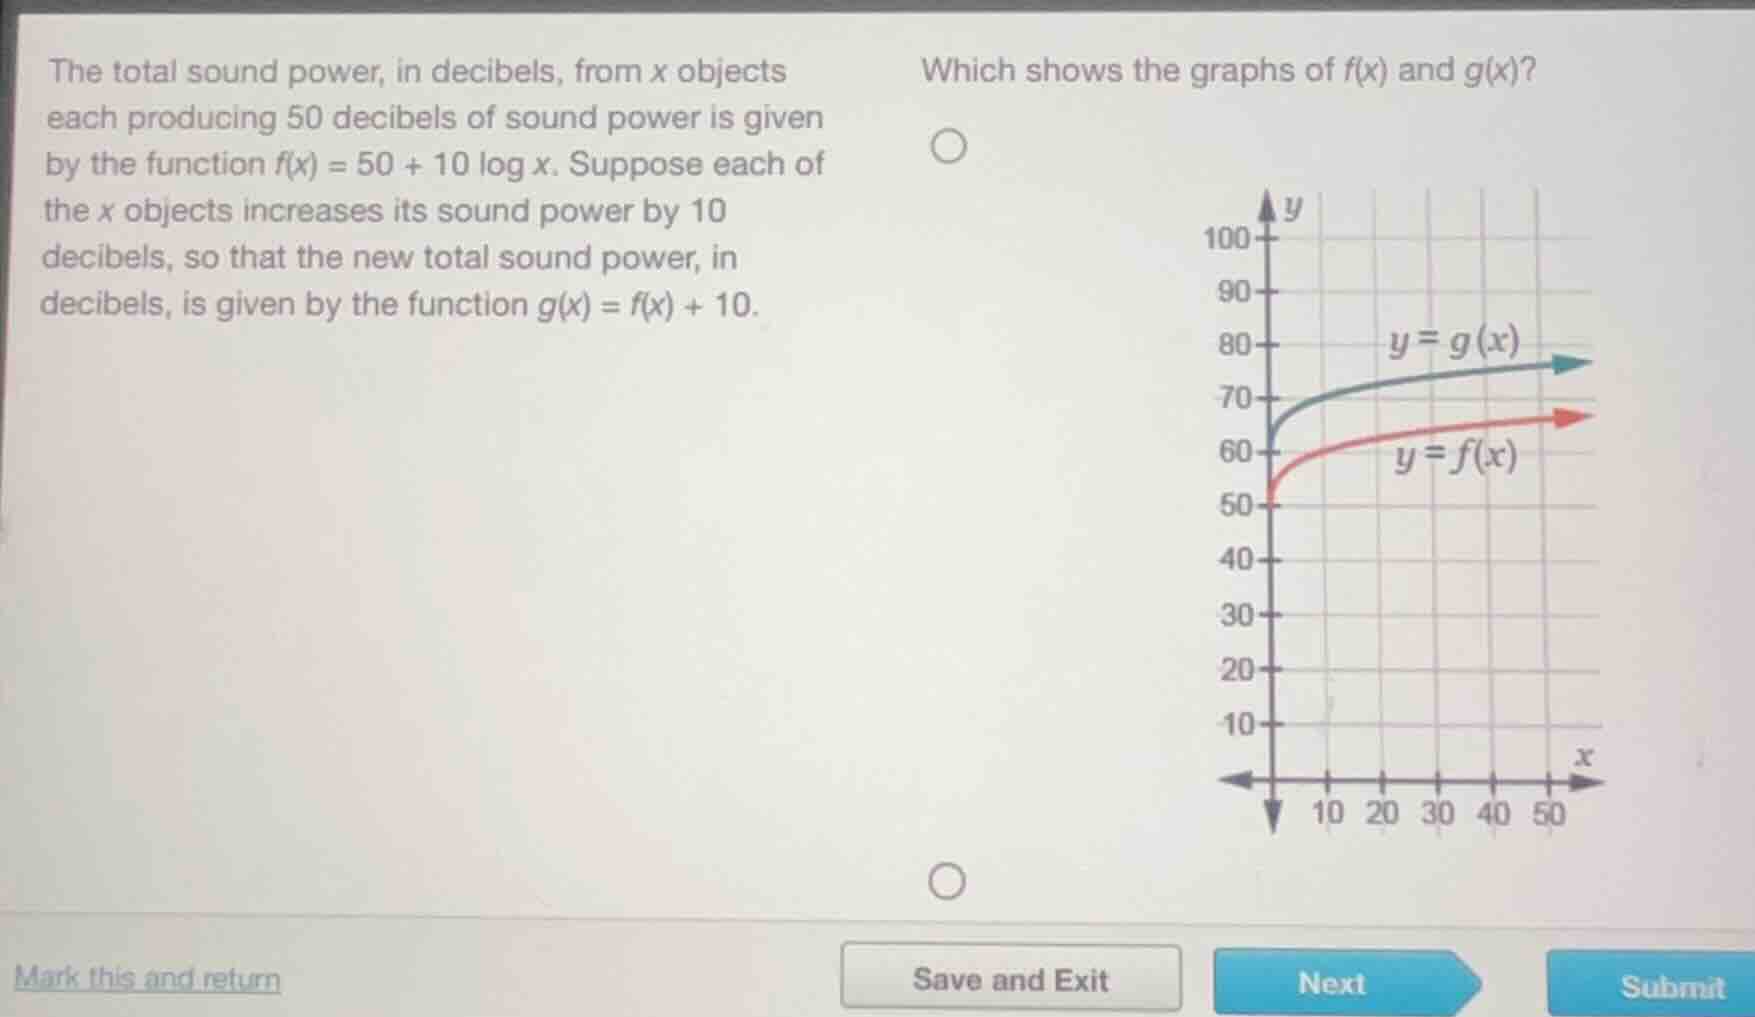
the total sound power, in decibels, from x objects each producing 50 decibels of sound power is given by the function $f(x) = 50 + 10 \log x$. suppose each of the x objects increases its sound power by 10 decibels, so that the new total sound power, in decibels, is given by the function $g(x) = f(x) + 10$.
which shows the graphs of $f(x)$ and $g(x)$?
Step1: Identify vertical shift rule
For $g(x)=f(x)+k$, shift $f(x)$ up by $k$.
Step2: Analyze initial values
For $x=1$, $f(1)=50+10\log1=50$, $g(1)=50+10=60$.
Step3: Verify graph match
The given graph has $g(x)$ 10 units above $f(x)$, matching the shift.

Snap & solve any problem in the app
Get step-by-step solutions on Sovi AI
Photo-based solutions with guided steps
Explore more problems and detailed explanations
The provided graph (with $y=g(x)$ as the upper curve and $y=f(x)$ as the lower curve) is the correct graph of $f(x)$ and $g(x)$.