QUESTION IMAGE
Question
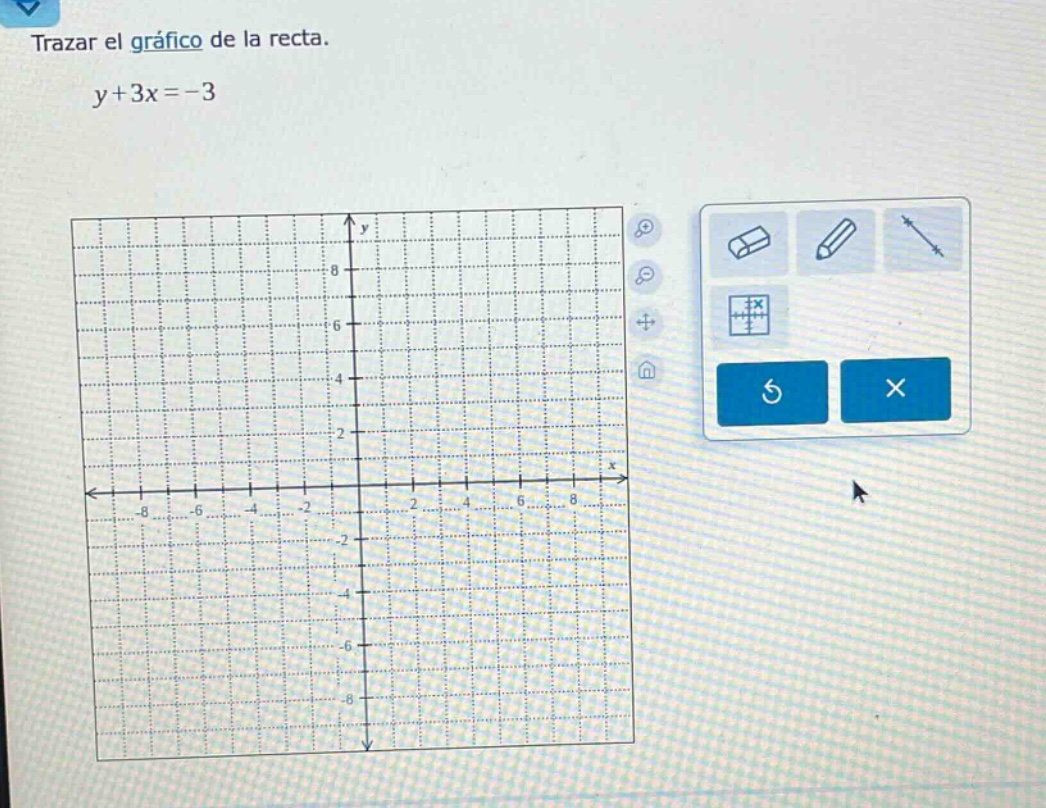
trazar el gráfico de la recta.
y + 3x = -3
Step1: Rewrite the equation in slope - intercept form
The slope - intercept form of a line is $y = mx + b$, where $m$ is the slope and $b$ is the y - intercept.
Starting with the equation $y+3x=-3$, we solve for $y$ by subtracting $3x$ from both sides:
$y=-3x - 3$
Step2: Find the y - intercept
The y - intercept occurs when $x = 0$. Substitute $x = 0$ into the equation $y=-3x - 3$:
$y=-3(0)-3=-3$
So, the y - intercept is the point $(0,-3)$.
Step3: Find the x - intercept
The x - intercept occurs when $y = 0$. Substitute $y = 0$ into the equation $y=-3x - 3$:
$0=-3x - 3$
Add $3x$ to both sides: $3x=-3$
Divide both sides by 3: $x = - 1$
So, the x - intercept is the point $(-1,0)$.
Step4: Plot the points and draw the line
Plot the points $(0,-3)$ (on the y - axis) and $(-1,0)$ (on the x - axis). Then, draw a straight line passing through these two points. This line represents the graph of the equation $y + 3x=-3$.

Snap & solve any problem in the app
Get step-by-step solutions on Sovi AI
Photo-based solutions with guided steps
Explore more problems and detailed explanations
To graph the line $y + 3x=-3$ (or $y=-3x - 3$), plot the points $(0,-3)$ (y - intercept) and $(-1,0)$ (x - intercept) and draw a straight line through them.