QUESTION IMAGE
Question
trend lines
practice - trend lines
name: ______________________ date: ________ period: __
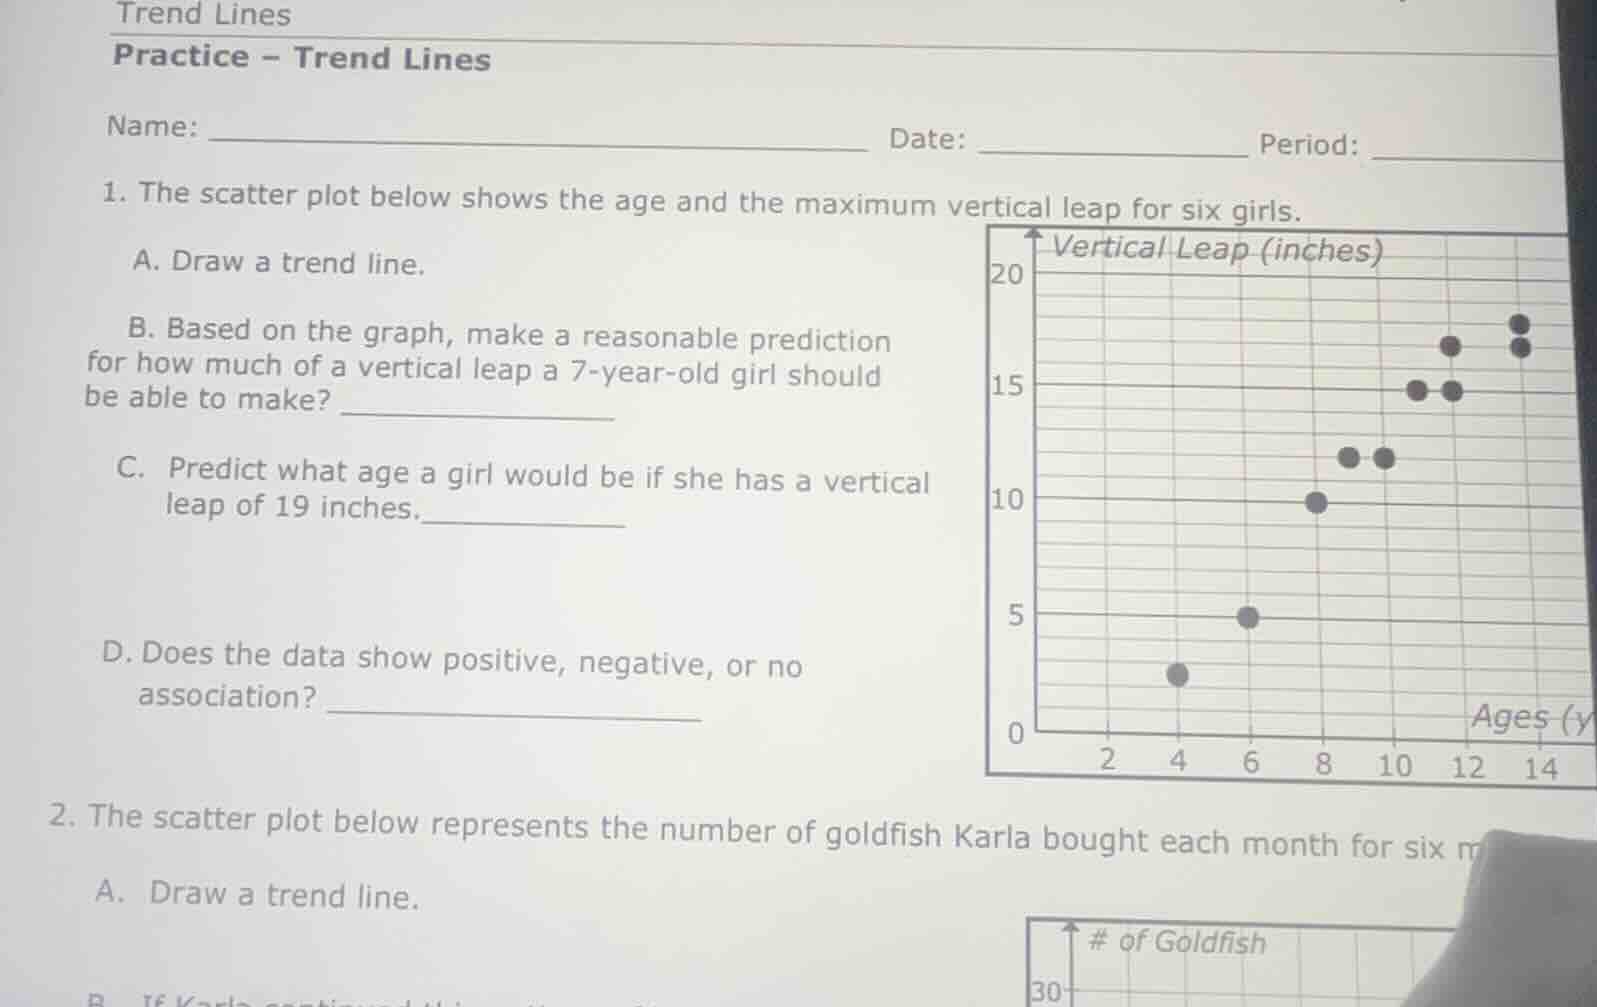
- the scatter plot below shows the age and the maximum vertical leap for six girls.
a. draw a trend line.
b. based on the graph, make a reasonable prediction
for how much of a vertical leap a 7-year-old girl should
be able to make? ____________
c. predict what age a girl would be if she has a vertical
leap of 19 inches.__________
d. does the data show positive, negative, or no
association? ____________
- the scatter plot below represents the number of goldfish karla bought each month for six m
a. draw a trend line.
Step1: Analyze scatter plot points
The plotted points are: (4,2), (6,5), (8,10), (10,12), (10,12), (12,15), (12,15), (14,17), (14,16), (14,18). A trend line will pass through the middle of these points, e.g., connecting (4,2) to (14,18).
Step2: Predict 7-year-old's vertical leap
Find x=7 on the x-axis, move up to the trend line. The corresponding y-value is ~8 inches.
Step3: Predict age for 19-inch leap
Find y=19 on the y-axis, move right to the trend line. The corresponding x-value is ~15 years.
Step4: Identify association type
As age (x) increases, vertical leap (y) increases, so it is positive.

Snap & solve any problem in the app
Get step-by-step solutions on Sovi AI
Photo-based solutions with guided steps
Explore more problems and detailed explanations
B. 8 inches
C. 15 years
D. Positive association
(Note: For part A, draw a straight line that passes through the center of the plotted data points, roughly balancing points above and below the line.)