QUESTION IMAGE
Question
tuesday, 1/13
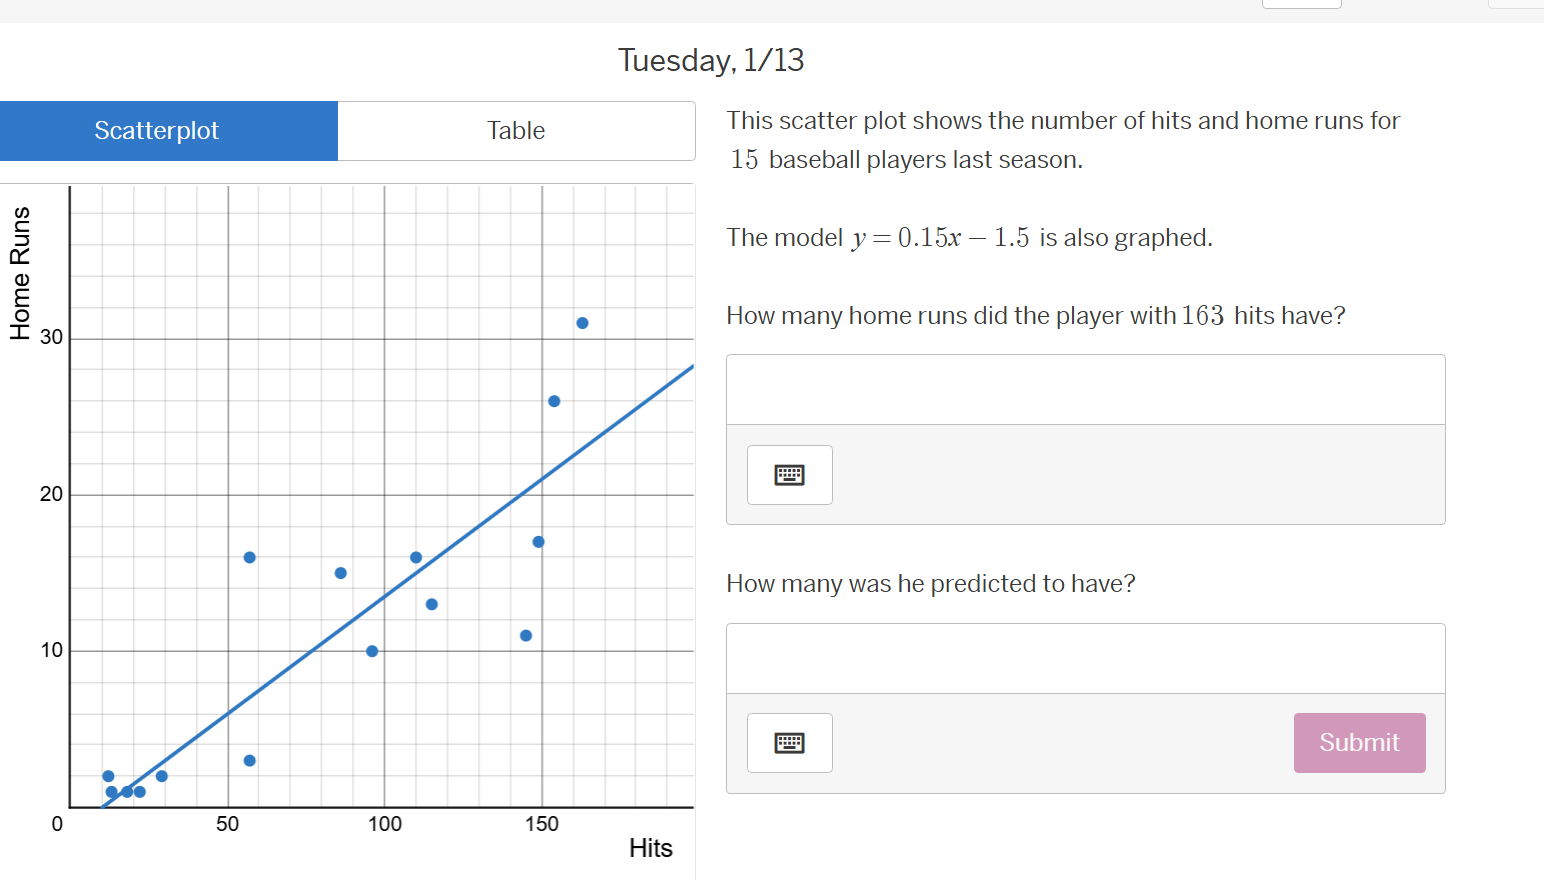
scatterplot table this scatter plot shows the number of hits and home runs for 15 baseball players last season.
the model $y = 0.15x - 1.5$ is also graphed.
how many home runs did the player with 163 hits have?
how many was he predicted to have?
First Sub - Question: How many home runs did the player with 163 hits have?
Step1: Locate the data point
We look at the scatter plot. The player with 163 hits has a data point at 31 home runs (by visually inspecting the scatter plot where the x - value is 163, the corresponding y - value (home runs) is 31).
Step1: Identify the prediction model
The prediction model is given by the equation \(y = 0.15x-1.5\), where \(x\) is the number of hits and \(y\) is the predicted number of home runs.
Step2: Substitute the value of \(x\)
We know that \(x = 163\). Substitute \(x = 163\) into the equation \(y=0.15x - 1.5\).
First, calculate \(0.15\times163\): \(0.15\times163=24.45\)
Then, subtract 1.5 from the result: \(y = 24.45-1.5\)
\(y = 22.95\approx23\) (if we consider rounding to the nearest whole number, or we can just present the exact value from the calculation)

Snap & solve any problem in the app
Get step-by-step solutions on Sovi AI
Photo-based solutions with guided steps
Explore more problems and detailed explanations
31