QUESTION IMAGE
Question
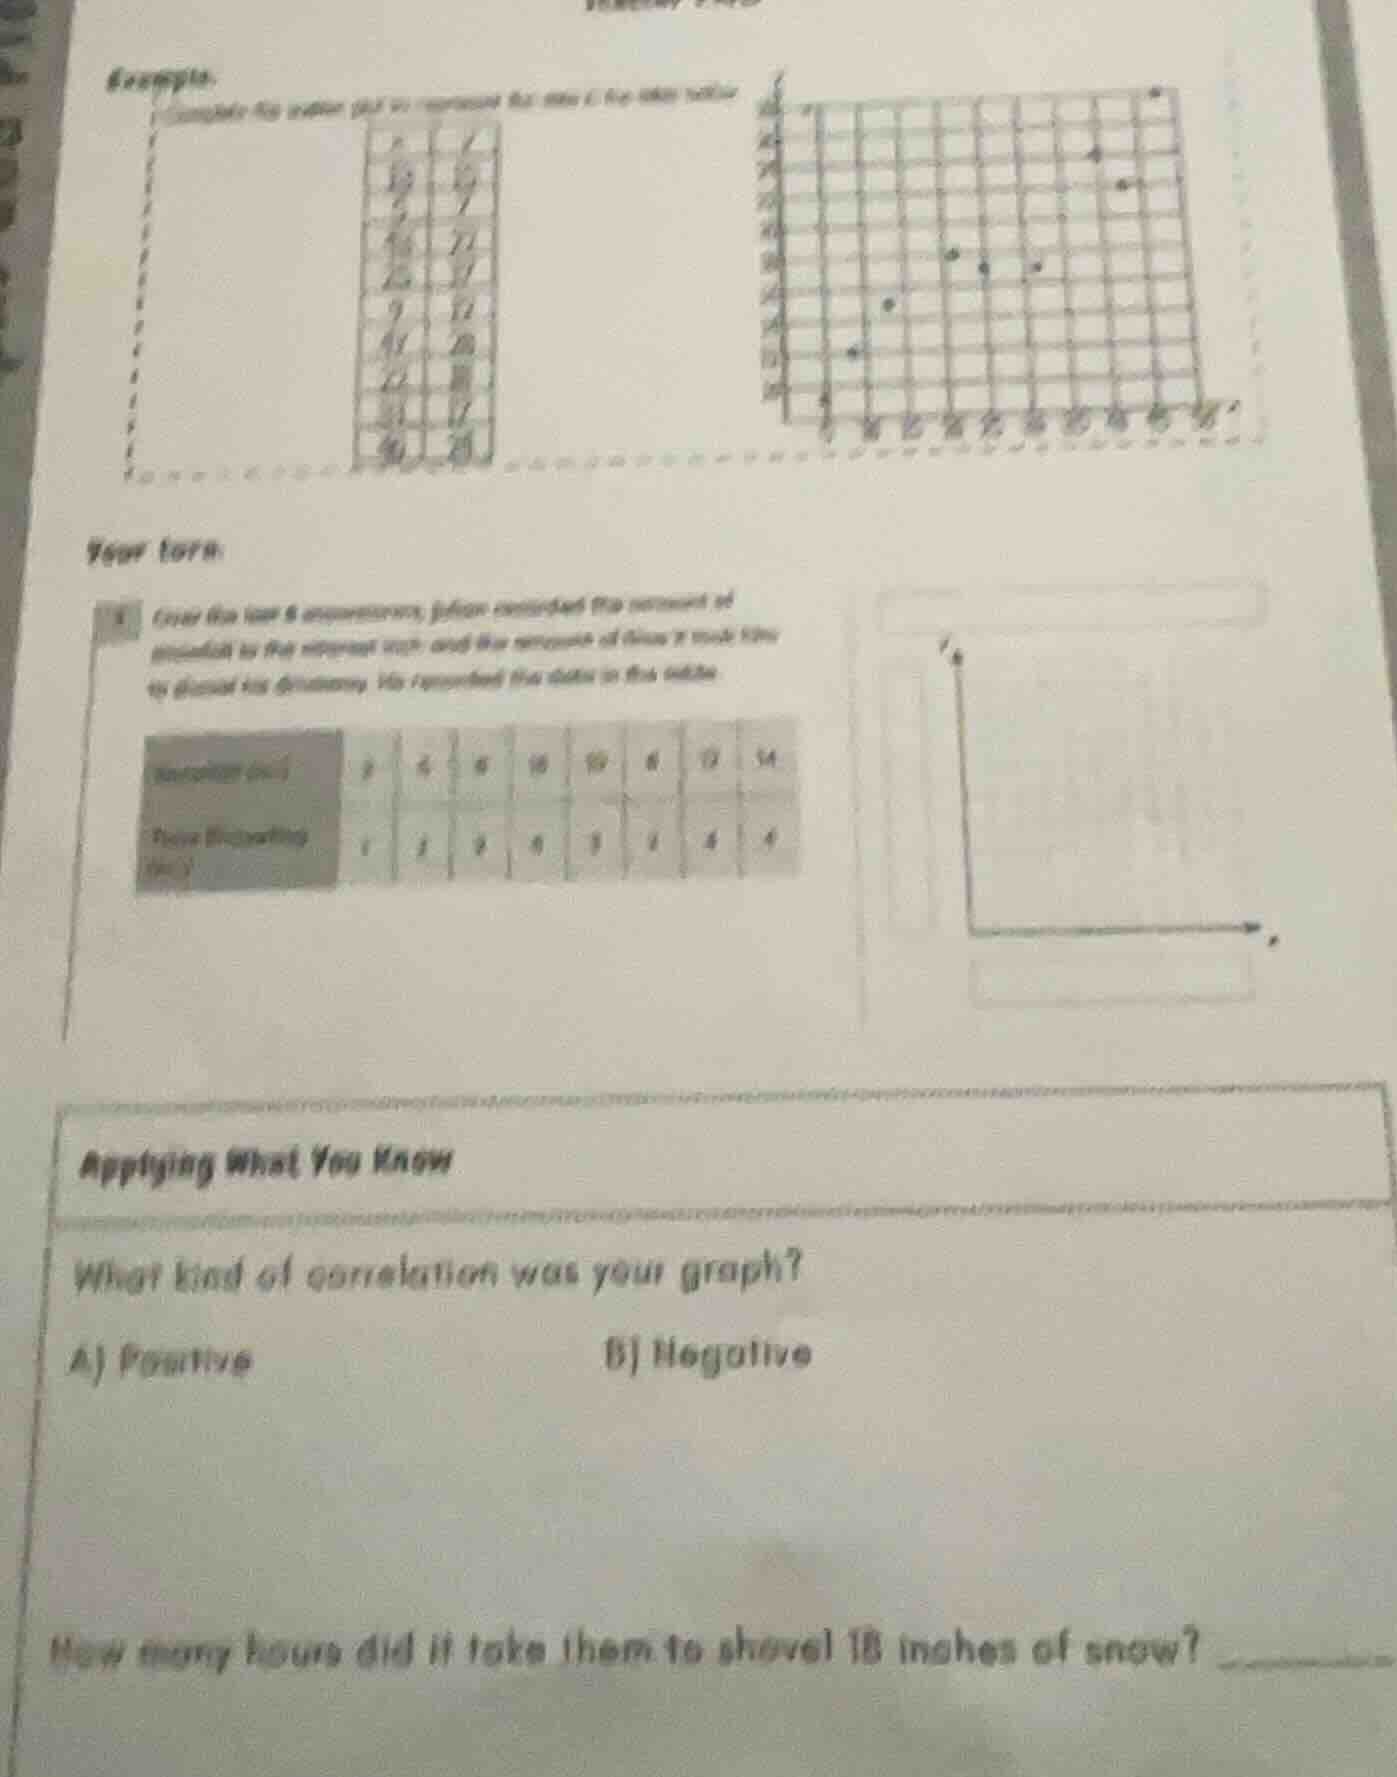
your turn:
1 over the last 8 snowstorms, john recorded the amount of snowfall in his driveway and the amount of time it took him to shovel his driveway. he recorded his data in the table.
applying what you know
what kind of correlation was your graph?
a) positive b) negative
how many hours did it take them to shovel 18 inches of snow?
Step1: Plot data points
Plot each pair $(x,y)$ where $x$ = Snowfall (in), $y$ = Time (hrs):
$(2,1), (4,1), (6,2), (10,4), (12,3), (8,1), (12,4), (14,4)$
Step2: Identify correlation trend
As $x$ (snowfall) increases, $y$ (time) generally increases.
Step3: Estimate time for 18 inches
Use the positive trend: each 2-4 inch increase adds ~1 hr. From 14 inches (4 hrs), adding 4 inches (to 18) adds ~1 hr.

Snap & solve any problem in the app
Get step-by-step solutions on Sovi AI
Photo-based solutions with guided steps
Explore more problems and detailed explanations
What kind of correlation was your graph?
A) Positive
How many hours did it take them to shovel 18 inches of snow?
$\boldsymbol{5}$