QUESTION IMAGE
Question
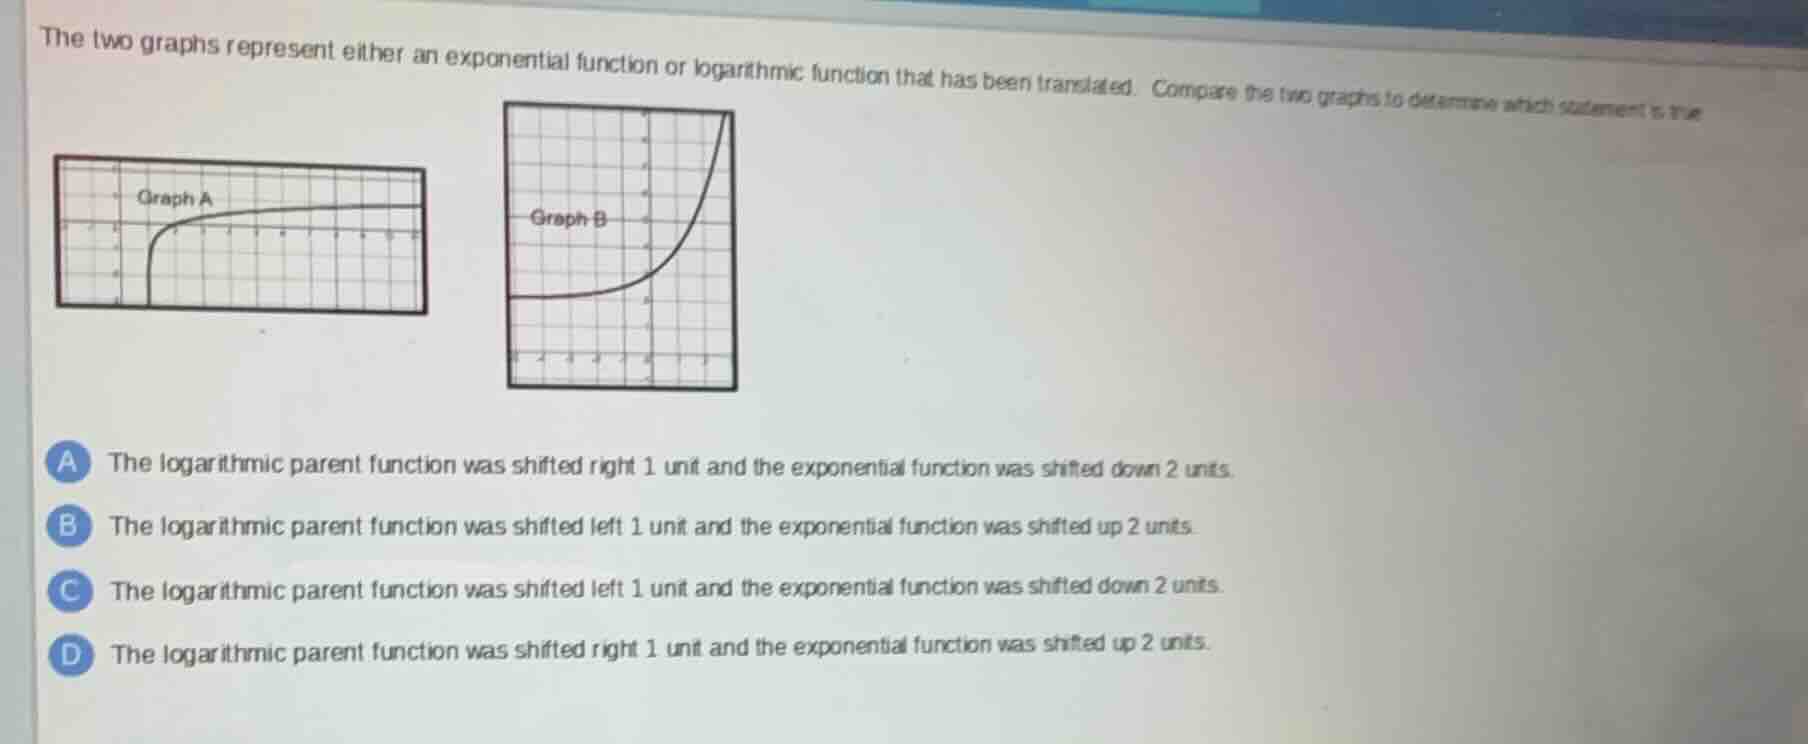
the two graphs represent either an exponential function or logarithmic function that has been translated. compare the two graphs to determine which statement is true
a the logarithmic parent function was shifted right 1 unit and the exponential function was shifted down 2 units.
b the logarithmic parent function was shifted left 1 unit and the exponential function was shifted up 2 units.
c the logarithmic parent function was shifted left 1 unit and the exponential function was shifted down 2 units.
d the logarithmic parent function was shifted right 1 unit and the exponential function was shifted up 2 units.
- Identify parent functions: Graph A has the shape of a parent logarithmic function $y=\log(x)$, which has a vertical asymptote at $x=0$ and passes through $(1,0)$. Graph B has the shape of a parent exponential function $y=b^x$ ($b>1$), which passes through $(0,1)$ and has a horizontal asymptote at $y=0$.
- Analyze Graph A (logarithmic) shift: The vertical asymptote of Graph A is at $x=1$, not $x=0$. For a logarithmic function, a vertical asymptote shift from $x=0$ to $x=1$ means the function is shifted right 1 unit.
- Analyze Graph B (exponential) shift: The horizontal asymptote of Graph B is at $y=-2$, not $y=0$. For an exponential function, a horizontal asymptote shift from $y=0$ to $y=-2$ means the function is shifted down 2 units.
- Match to options: This matches the description in option A.

Snap & solve any problem in the app
Get step-by-step solutions on Sovi AI
Photo-based solutions with guided steps
Explore more problems and detailed explanations
A. The logarithmic parent function was shifted right 1 unit and the exponential function was shifted down 2 units.