QUESTION IMAGE
Question
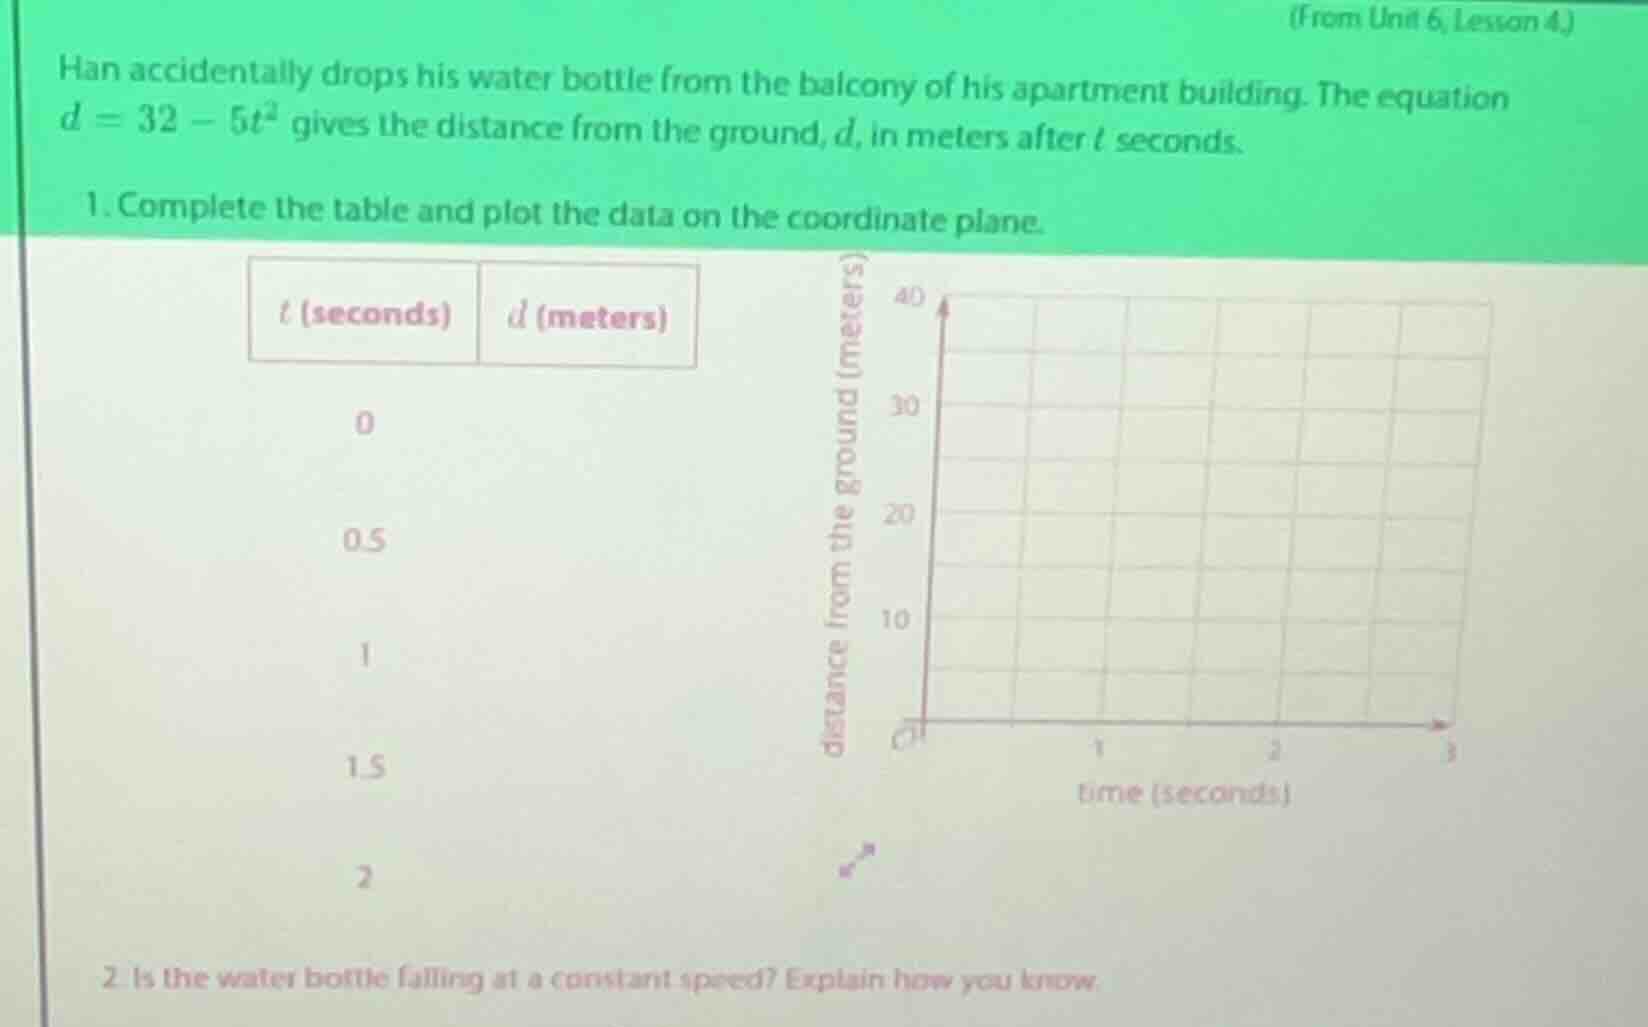
(from unit 6, lesson 4.) han accidentally drops his water bottle from the balcony of his apartment building. the equation ( d = 32 - 5t^2 ) gives the distance from the ground, ( d ), in meters after ( t ) seconds. 1. complete the table and plot the data on the coordinate plane. 2. is the water bottle falling at a constant speed? explain how you know.
Part 1: Completing the Table
Step 1: For \( t = 0 \)
Substitute \( t = 0 \) into \( d = 32 - 5t^2 \).
\( d = 32 - 5(0)^2 = 32 - 0 = 32 \)
Step 2: For \( t = 0.5 \)
Substitute \( t = 0.5 \) into the equation.
\( d = 32 - 5(0.5)^2 = 32 - 5(0.25) = 32 - 1.25 = 30.75 \)
Step 3: For \( t = 1 \)
Substitute \( t = 1 \).
\( d = 32 - 5(1)^2 = 32 - 5 = 27 \)
Step 4: For \( t = 1.5 \)
Substitute \( t = 1.5 \).
\( d = 32 - 5(1.5)^2 = 32 - 5(2.25) = 32 - 11.25 = 20.75 \)
Step 5: For \( t = 2 \)
Substitute \( t = 2 \).
\( d = 32 - 5(2)^2 = 32 - 5(4) = 32 - 20 = 12 \)
The completed table is:
| \( t \) (seconds) | \( d \) (meters) |
|---|---|
| 0.5 | 30.75 |
| 1 | 27 |
| 1.5 | 20.75 |
| 2 | 12 |
To plot the data, use the \( t \)-values as the x - coordinates and the corresponding \( d \)-values as the y - coordinates. For example, the points are \((0, 32)\), \((0.5, 30.75)\), \((1, 27)\), \((1.5, 20.75)\), and \((2, 12)\). Plot these points on the given coordinate plane where the x - axis is time (seconds) and the y - axis is distance from the ground (meters).
Part 2: Constant Speed Analysis
To determine if the speed is constant, we can look at the rate of change of distance with respect to time (speed). For a constant speed, the change in distance (\(\Delta d\)) per unit change in time (\(\Delta t\)) should be constant.
First, calculate the change in distance between consecutive time intervals:
- From \( t = 0 \) to \( t = 0.5 \): \(\Delta t=0.5 - 0 = 0.5\) seconds, \(\Delta d=30.75 - 32=- 1.25\) meters. The average speed (magnitude) is \(\frac{\vert\Delta d\vert}{\Delta t}=\frac{1.25}{0.5} = 2.5\) m/s.
- From \( t = 0.5 \) to \( t = 1 \): \(\Delta t = 1 - 0.5=0.5\) seconds, \(\Delta d=27 - 30.75=-3.75\) meters. The average speed is \(\frac{\vert - 3.75\vert}{0.5}=\frac{3.75}{0.5} = 7.5\) m/s.
- From \( t = 1 \) to \( t = 1.5 \): \(\Delta t=1.5 - 1 = 0.5\) seconds, \(\Delta d=20.75 - 27=-6.25\) meters. The average speed is \(\frac{\vert - 6.25\vert}{0.5}=\frac{6.25}{0.5}=12.5\) m/s.
- From \( t = 1.5 \) to \( t = 2 \): \(\Delta t=2 - 1.5 = 0.5\) seconds, \(\Delta d=12 - 20.75=-8.75\) meters. The average speed is \(\frac{\vert - 8.75\vert}{0.5}=\frac{8.75}{0.5} = 17.5\) m/s.
Since the average speed (rate of change of distance) is increasing as time increases (the magnitude of \(\Delta d\) is increasing for the same \(\Delta t\)), the water bottle is not falling at a constant speed. Another way to see this is from the equation \( d = 32-5t^2 \). This is a quadratic equation, and the graph of \( d \) vs \( t \) is a parabola (not a straight line). For an object moving at a constant speed, the distance - time graph should be a straight line (since \( d=v\times t + d_0\), which is linear). Since the graph of \( d \) against \( t \) is a parabola, the speed (which is the slope of the tangent to the \( d - t \) curve) is not constant.

Snap & solve any problem in the app
Get step-by-step solutions on Sovi AI
Photo-based solutions with guided steps
Explore more problems and detailed explanations
s:
Part 1:
The completed table is:
| \( t \) (seconds) | \( d \) (meters) |
|---|---|
| 0.5 | 30.75 |
| 1 | 27 |
| 1.5 | 20.75 |
| 2 | 12 |
(For plotting, plot the points \((0, 32)\), \((0.5, 30.75)\), \((1, 27)\), \((1.5, 20.75)\), \((2, 12)\) on the given coordinate plane.)
Part 2:
The water bottle is not falling at a constant speed. We know this because the average speed (calculated from the change in distance over equal time intervals) is increasing, and the distance - time relationship is quadratic (the graph of \( d \) vs \( t \) is a parabola, not a straight line), which implies that the speed (slope of the \( d - t \) curve) is changing.