QUESTION IMAGE
Question
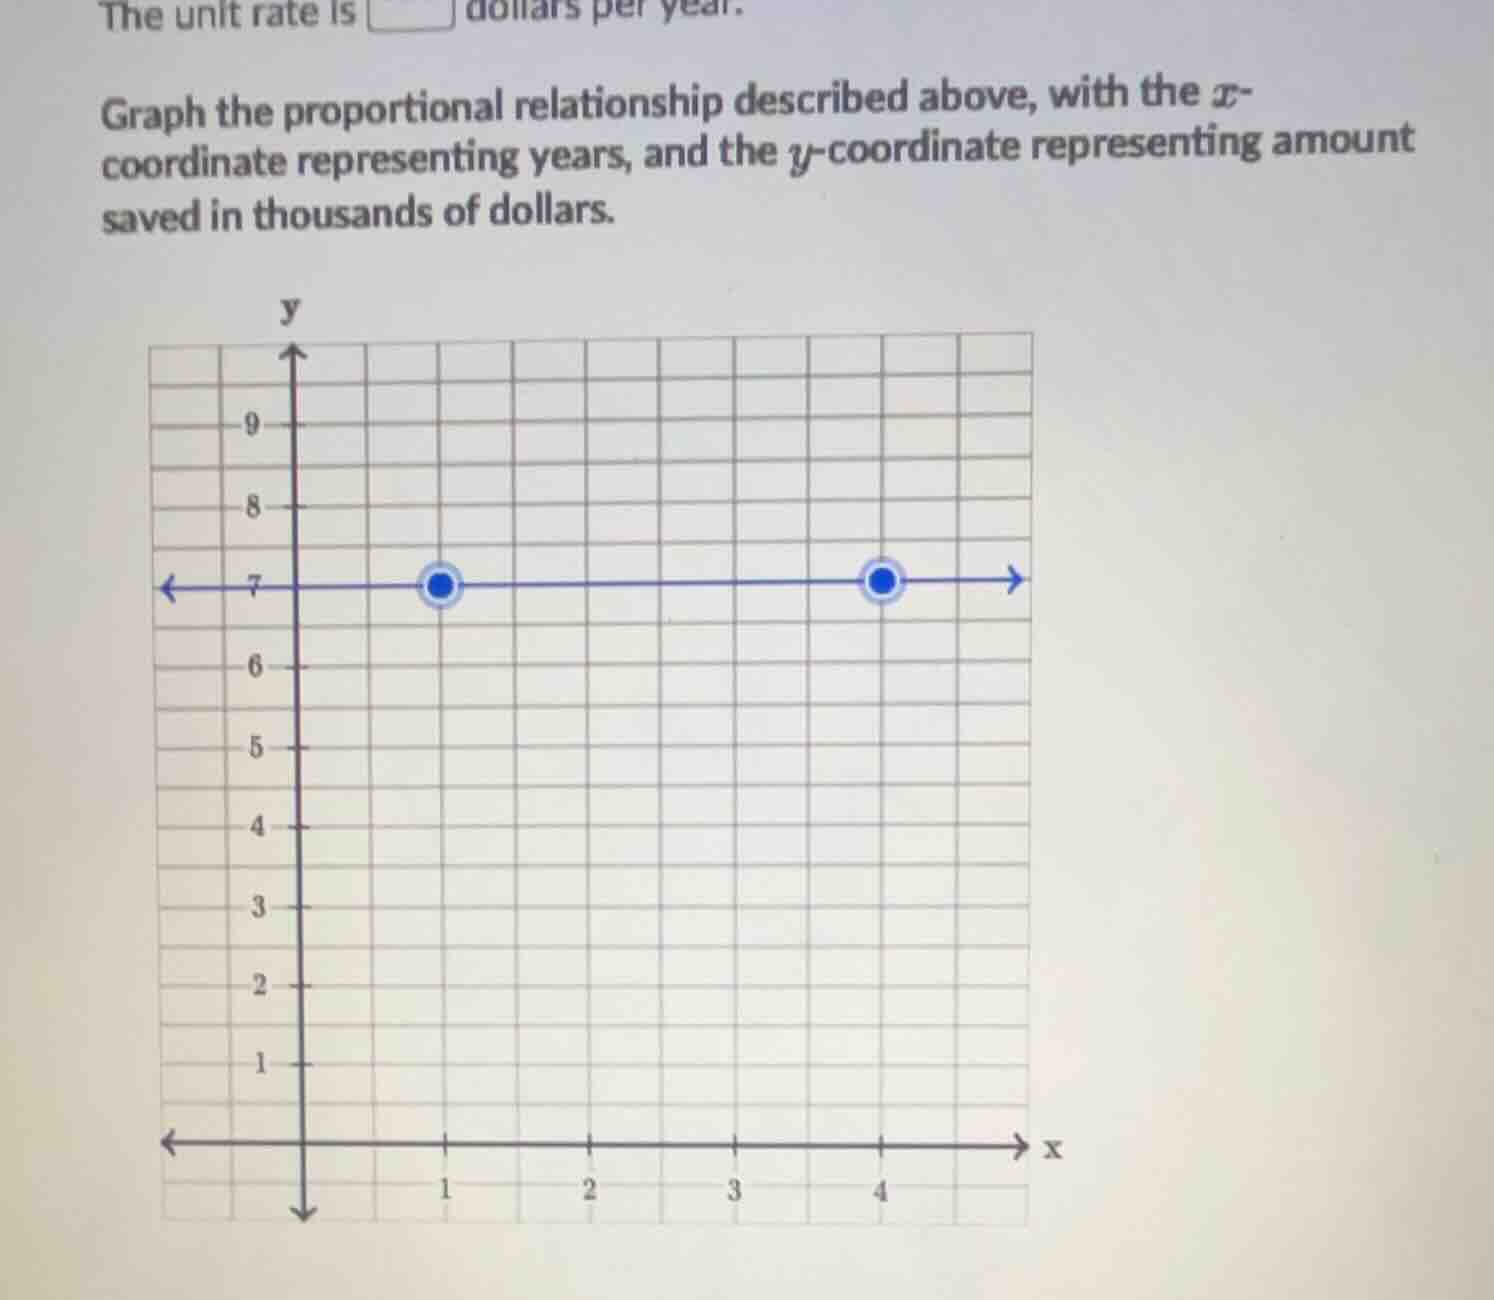
the unit rate is \square dollars per year.
graph the proportional relationship described above, with the x-coordinate representing years, and the y-coordinate representing amount saved in thousands of dollars.
To determine the unit rate (dollars per year) and graph the proportional relationship, we analyze the given graph:
Step 1: Identify Coordinates
The graph shows two points:
- When \( x = 1 \) (year 1), \( y = 7 \) (thousands of dollars saved).
- When \( x = 4 \) (year 4), \( y = 7 \) (thousands of dollars saved). Wait, no—wait, the \( y \)-axis is “amount saved in thousands of dollars.” Wait, actually, the line is horizontal at \( y = 7 \). Wait, that would mean the amount saved does not change over time. But the problem mentions a “proportional relationship,” which is typically linear with a constant rate. Wait, maybe the initial unit rate question is missing? Wait, the first part says “The unit rate is [ ] dollars per year.” Let’s re-express:
If \( y \) is in thousands of dollars, and \( x \) is in years, the slope (unit rate) is \( \frac{\Delta y}{\Delta x} \). From the graph, the \( y \)-value is constant (7 thousand dollars) for all \( x \) (years). Wait, that would mean the rate of saving is \( 0 \) dollars per year (since the amount saved doesn’t change). But maybe the graph is misinterpreted. Wait, the blue dots are at \( (1, 7) \) and \( (4, 7) \), so \( \Delta y = 0 \), \( \Delta x = 3 \), so slope \( = \frac{0}{3} = 0 \). Thus, the unit rate is \( 0 \) dollars per year (no saving or spending, amount stays constant).
Step 2: Graph the Proportional Relationship
A proportional relationship has the form \( y = kx \), where \( k \) is the constant of proportionality (unit rate). Here, \( k = 0 \), so the equation is \( y = 0 \cdot x \), or \( y = 0 \). This is a horizontal line along \( y = 7 \) (since the initial amount saved is 7 thousand dollars, and it never changes).
(for unit rate):
Step 1: Analyze the graph’s coordinates
The \( y \)-coordinate (thousands of dollars saved) is 7 for \( x = 1 \) and \( x = 4 \). So \( \Delta y = 7 - 7 = 0 \), \( \Delta x = 4 - 1 = 3 \).
Step 2: Calculate the unit rate (slope)
Unit rate \( = \frac{\Delta y}{\Delta x} = \frac{0}{3} = 0 \) dollars per year (since \( y \) is in thousands, but the rate of change is 0).

Snap & solve any problem in the app
Get step-by-step solutions on Sovi AI
Photo-based solutions with guided steps
Explore more problems and detailed explanations
(unit rate):
\( 0 \)
(For the graph: Draw a horizontal line through \( y = 7 \) (thousands of dollars) for all \( x \)-values (years).)