QUESTION IMAGE
Question
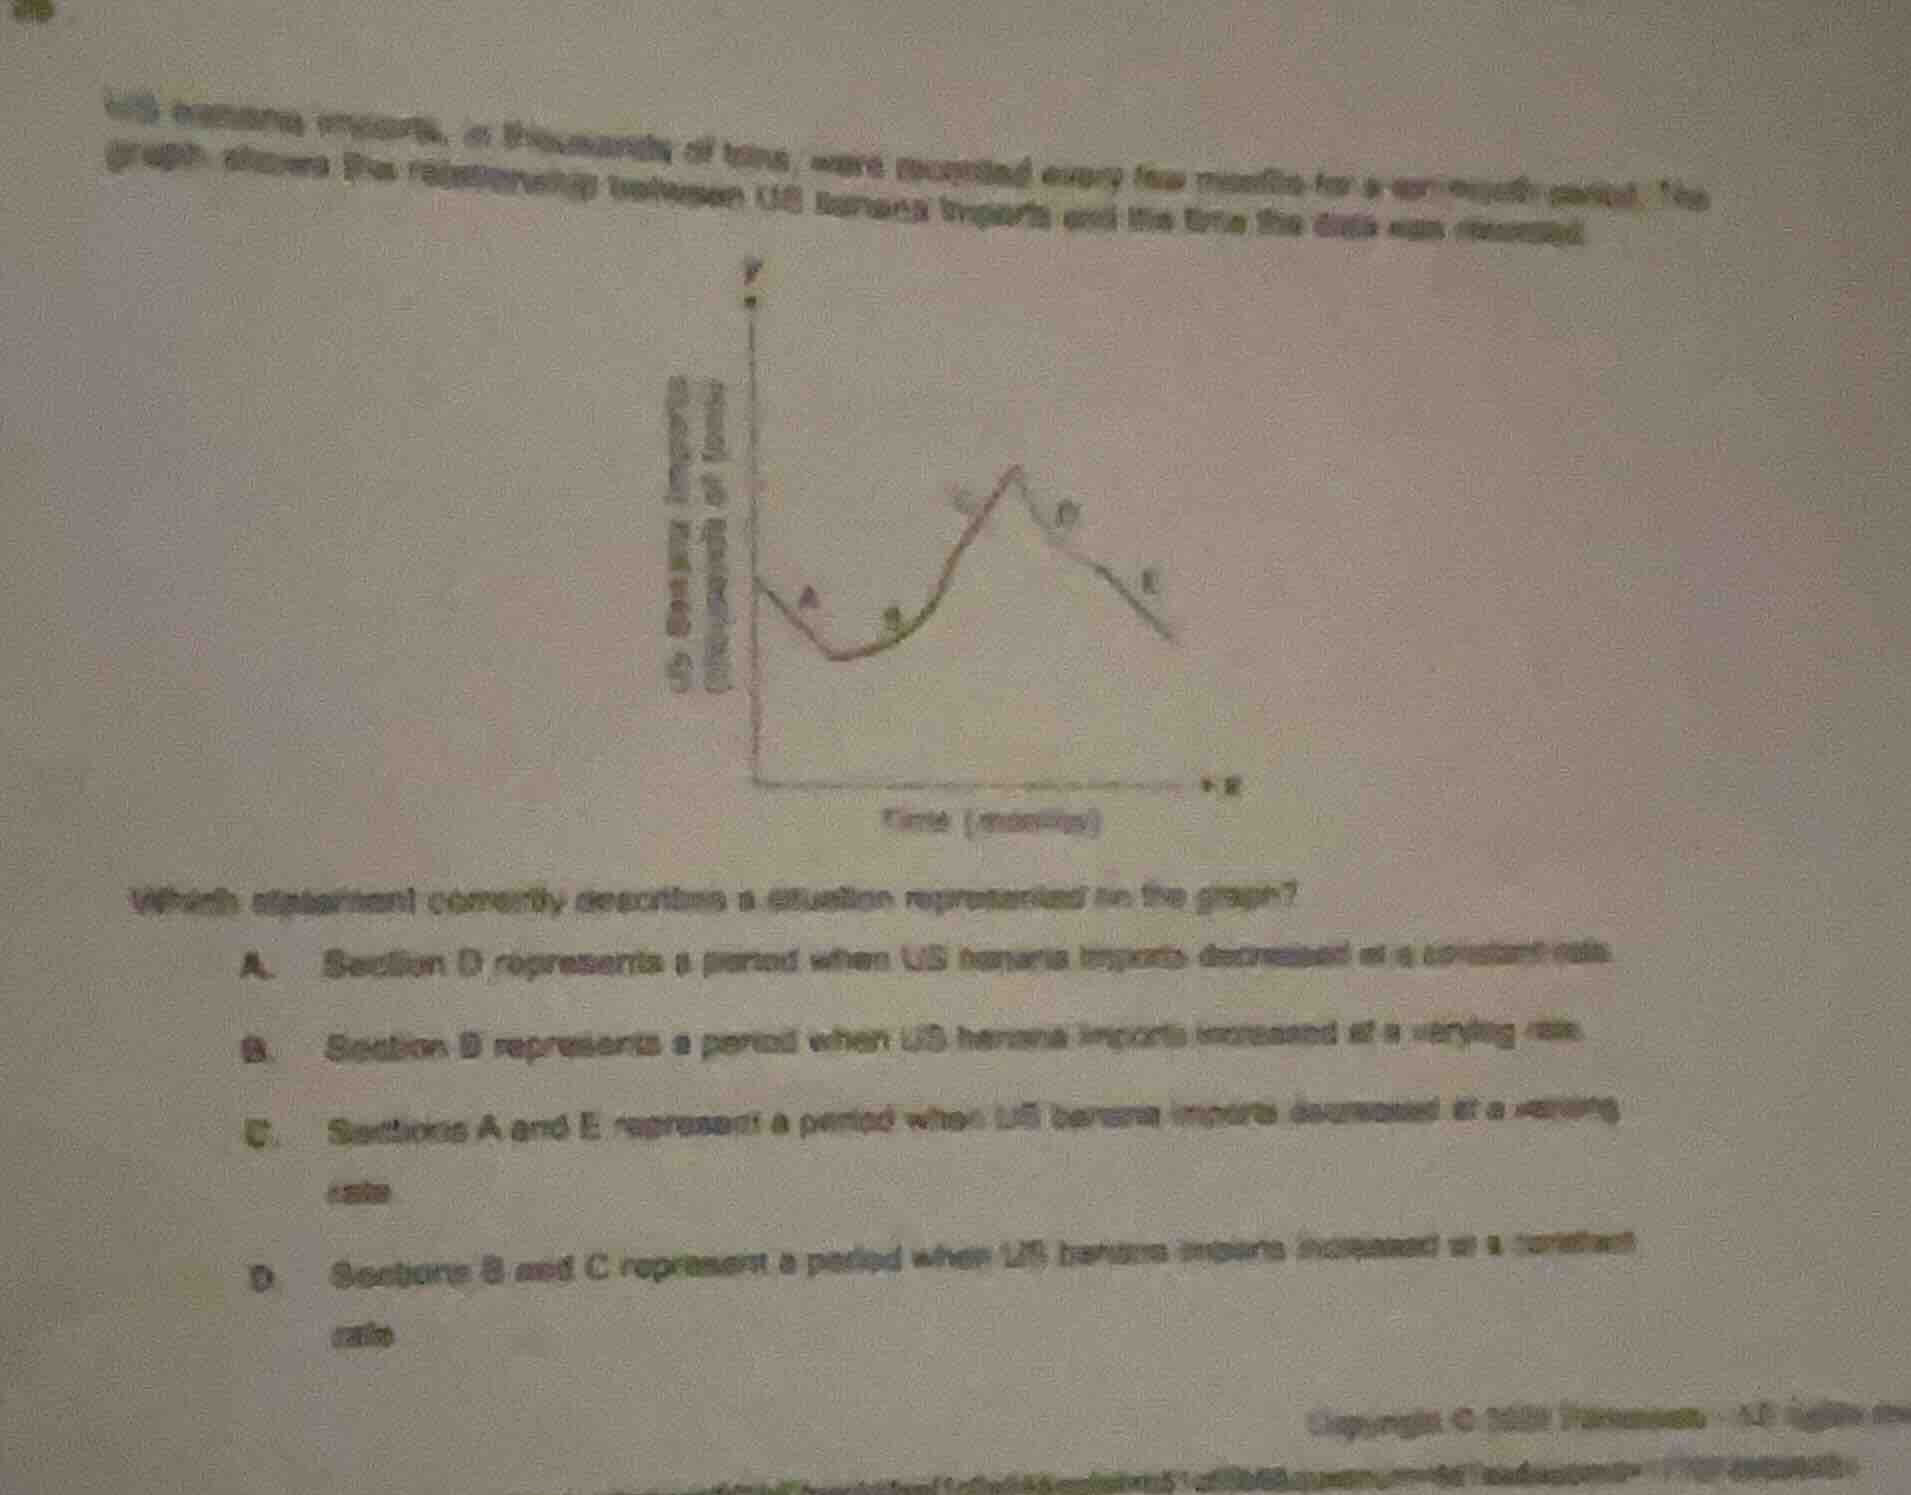
us banana imports, in thousands of tons, were recorded every few months for a certain period. the graph shows the relationship between us banana imports and the time the data was recorded.which statement correctly describes a situation represented in the graph?a. section d represents a period when us banana imports decreased at a constant rateb. section b represents a period when us banana imports increased at a varying ratec. sections a and e represent a period when us banana imports decreased at a varying rated. sections b and c represent a period when us banana imports increased at a constant rate
- For Option A: Section D is a curved downward line, meaning the rate of decrease is not constant (constant rate would be a straight line). So A is incorrect.
- For Option B: Section B is a curved upward line, which means the rate of increase changes (varies) over time, rather than being constant. This matches the graph.
- For Option C: Section A is a straight downward line, so it has a constant rate of decrease, not varying. So C is incorrect.
- For Option D: Sections B and C have curved lines, so their rate of increase is varying, not constant. So D is incorrect.

Snap & solve any problem in the app
Get step-by-step solutions on Sovi AI
Photo-based solutions with guided steps
Explore more problems and detailed explanations
B. Section B represents a period when US banana imports increased at a varying rate.