QUESTION IMAGE
Question
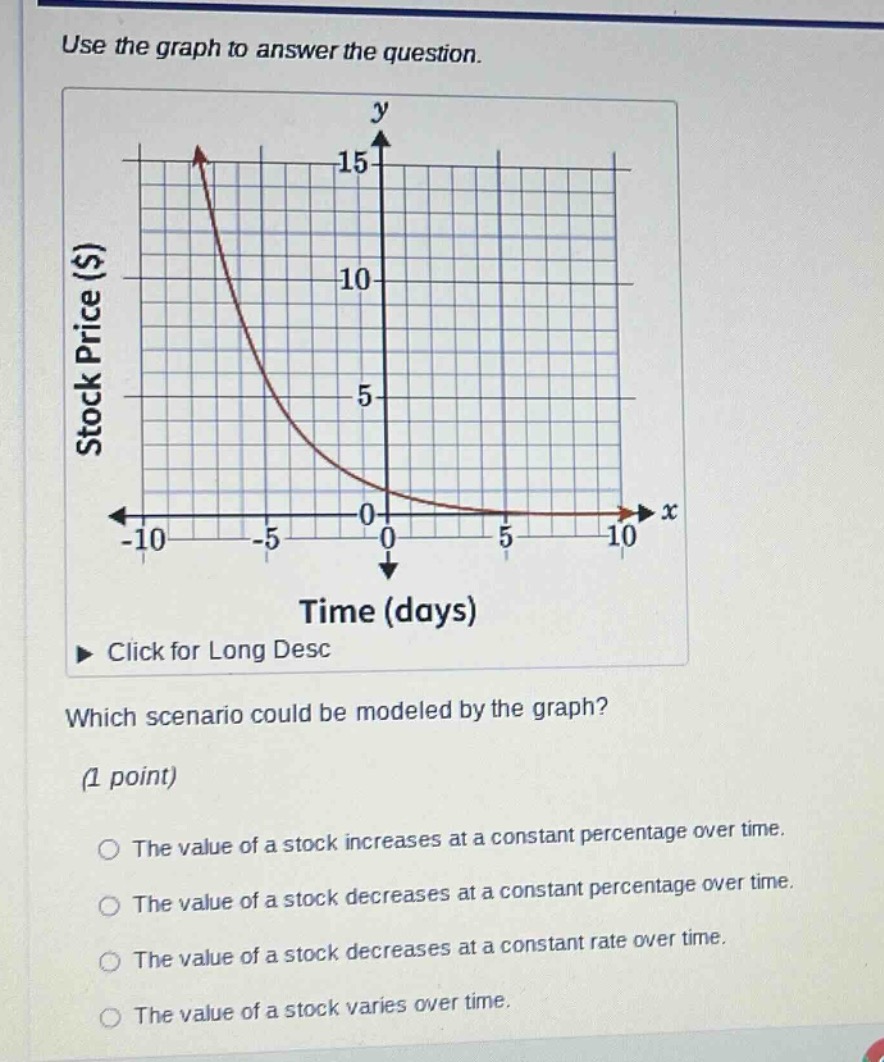
use the graph to answer the question.
stock price ($)
time (days)
click for long desc
which scenario could be modeled by the graph?
(1 point)
the value of a stock increases at a constant percentage over time.
the value of a stock decreases at a constant percentage over time.
the value of a stock decreases at a constant rate over time.
the value of a stock varies over time.
Brief Explanations
- Analyze the graph's shape: The graph is a curve (not a straight line), so it's an exponential or logarithmic model, not linear. A constant rate decrease would be a straight line (linear), so eliminate the "constant rate" option.
- Direction of change: The graph shows stock price decreasing as time (x - positive values, since time can't be negative in context, but the curve for x ≥ 0) increases. So it's a decrease, not an increase, eliminating the "increases" option.
- Type of decrease: The curve is exponential decay (constant percentage decrease), as opposed to linear (constant rate). The "varies" option is too vague; the graph shows a consistent decreasing pattern with a constant percentage rate.

Snap & solve any problem in the app
Get step-by-step solutions on Sovi AI
Photo-based solutions with guided steps
Explore more problems and detailed explanations
The value of a stock decreases at a constant percentage over time.