QUESTION IMAGE
Question
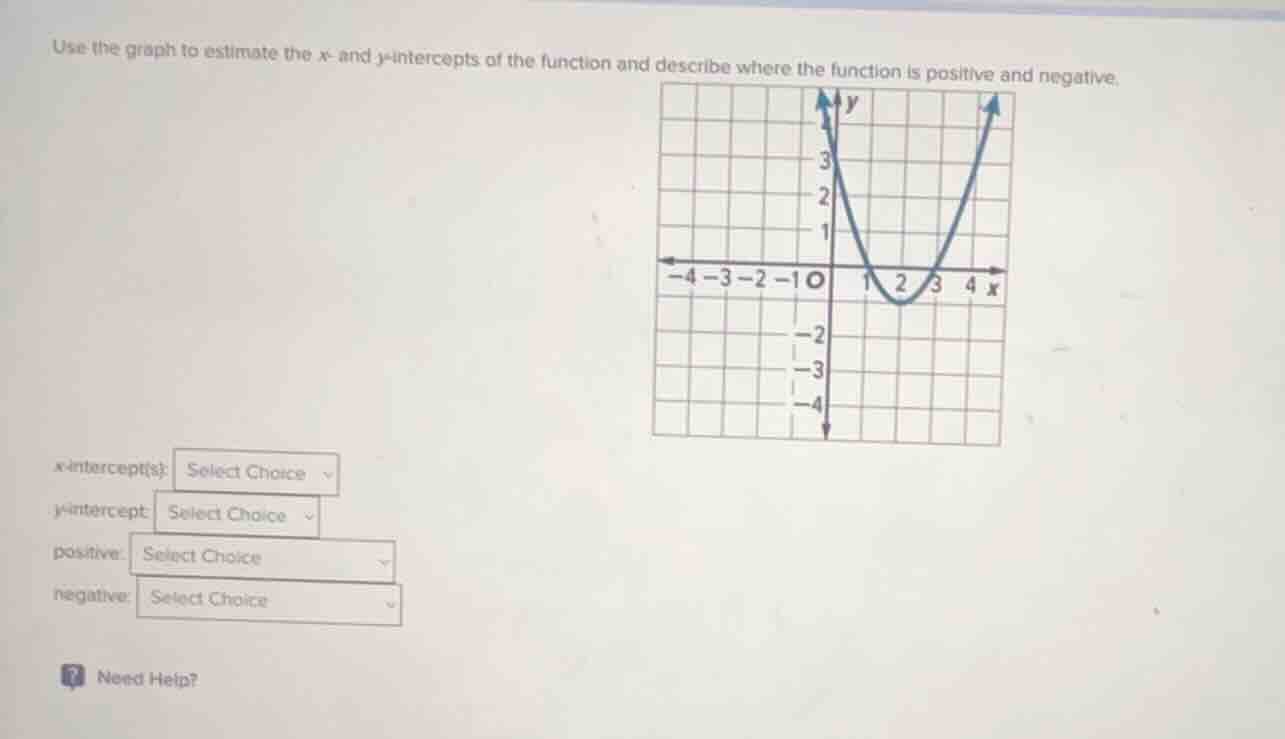
use the graph to estimate the x - and y - intercepts of the function and describe where the function is positive and negative.
x - intercept(s): select choice
y - intercept: select choice
positive: select choice
negative: select choice
need help?
Step1: Identify x - intercepts
The x - intercepts are the points where the graph intersects the x - axis (where \(y = 0\)). From the graph, we can see that the parabola intersects the x - axis at \(x = 1\) and \(x=3\). So the x - intercepts are \((1,0)\) and \((3,0)\), or in terms of x - values, \(x = 1\) and \(x = 3\).
Step2: Identify y - intercept
The y - intercept is the point where the graph intersects the y - axis (where \(x = 0\)). Looking at the graph, when \(x = 0\), the value of \(y\) is \(4\) (wait, no, looking at the graph again, when \(x = 0\), the y - value is \(4\)? Wait, no, the graph at \(x = 0\) is at \(y = 4\)? Wait, no, the grid: the y - axis has marks. Wait, the graph crosses the y - axis at \((0,4)\)? Wait, no, let's check the graph again. Wait, the y - axis: when \(x = 0\), the point is at \(y = 4\)? Wait, no, the graph is a parabola opening upwards. At \(x = 0\), the y - coordinate is \(4\)? Wait, no, the y - axis: the vertical axis. Let's see the graph: when \(x = 0\), the point is \((0,4)\)? Wait, no, maybe I misread. Wait, the graph at \(x = 0\) is at \(y = 4\)? Wait, no, the y - axis: the first mark above the origin is \(1\), then \(2\), \(3\), \(4\). So when \(x = 0\), the graph is at \(y = 4\)? Wait, no, the graph starts at the top? Wait, no, the parabola: when \(x = 0\), the y - intercept is \((0,4)\)? Wait, no, let's re - examine. Wait, the graph: at \(x = 0\), the point is \((0,4)\)? Wait, maybe I made a mistake. Wait, the graph: when \(x = 0\), the y - value is \(4\)? Wait, no, the y - axis: the vertical axis. Let's see the graph: the parabola crosses the y - axis at \((0,4)\)? Wait, no, maybe it's \((0,4)\). Wait, but let's check the x - intercepts again. The parabola intersects the x - axis at \(x = 1\) and \(x = 3\), so x - intercepts are \(x = 1\) and \(x = 3\) (or \((1,0)\) and \((3,0)\)).
Step3: Determine where the function is positive
A function is positive when its graph is above the x - axis (\(y>0\)). The parabola opens upwards, and it is above the x - axis when \(x<1\) or \(x > 3\) (wait, no: wait, the parabola is above the x - axis when \(x<1\) (to the left of \(x = 1\)) and \(x>3\) (to the right of \(x = 3\)), and below the x - axis between \(x = 1\) and \(x = 3\). Wait, no: wait, the parabola opens upwards, so the vertex is at the minimum point. The vertex is between \(x = 1\) and \(x = 3\), at \(x = 2\), \(y=- 1\) (from the graph). So the function is positive when \(x<1\) or \(x>3\) (because outside the interval between the two x - intercepts, the parabola is above the x - axis), and negative when \(1 The function is negative when its graph is below the x - axis (\(y < 0\)). From the graph, this occurs between the two x - intercepts, i.e., when \(1Step4: Determine where the function is negative

Snap & solve any problem in the app
Get step-by-step solutions on Sovi AI
Photo-based solutions with guided steps
Explore more problems and detailed explanations
x - intercept(s): \(x = 1\) and \(x = 3\) (or \((1,0)\) and \((3,0)\))
y - intercept: \(y = 4\) (or \((0,4)\))
positive: \(x<1\) or \(x>3\) (in interval notation: \((-\infty,1)\cup(3,\infty)\))
negative: \(1 < x<3\) (in interval notation: \((1,3)\))