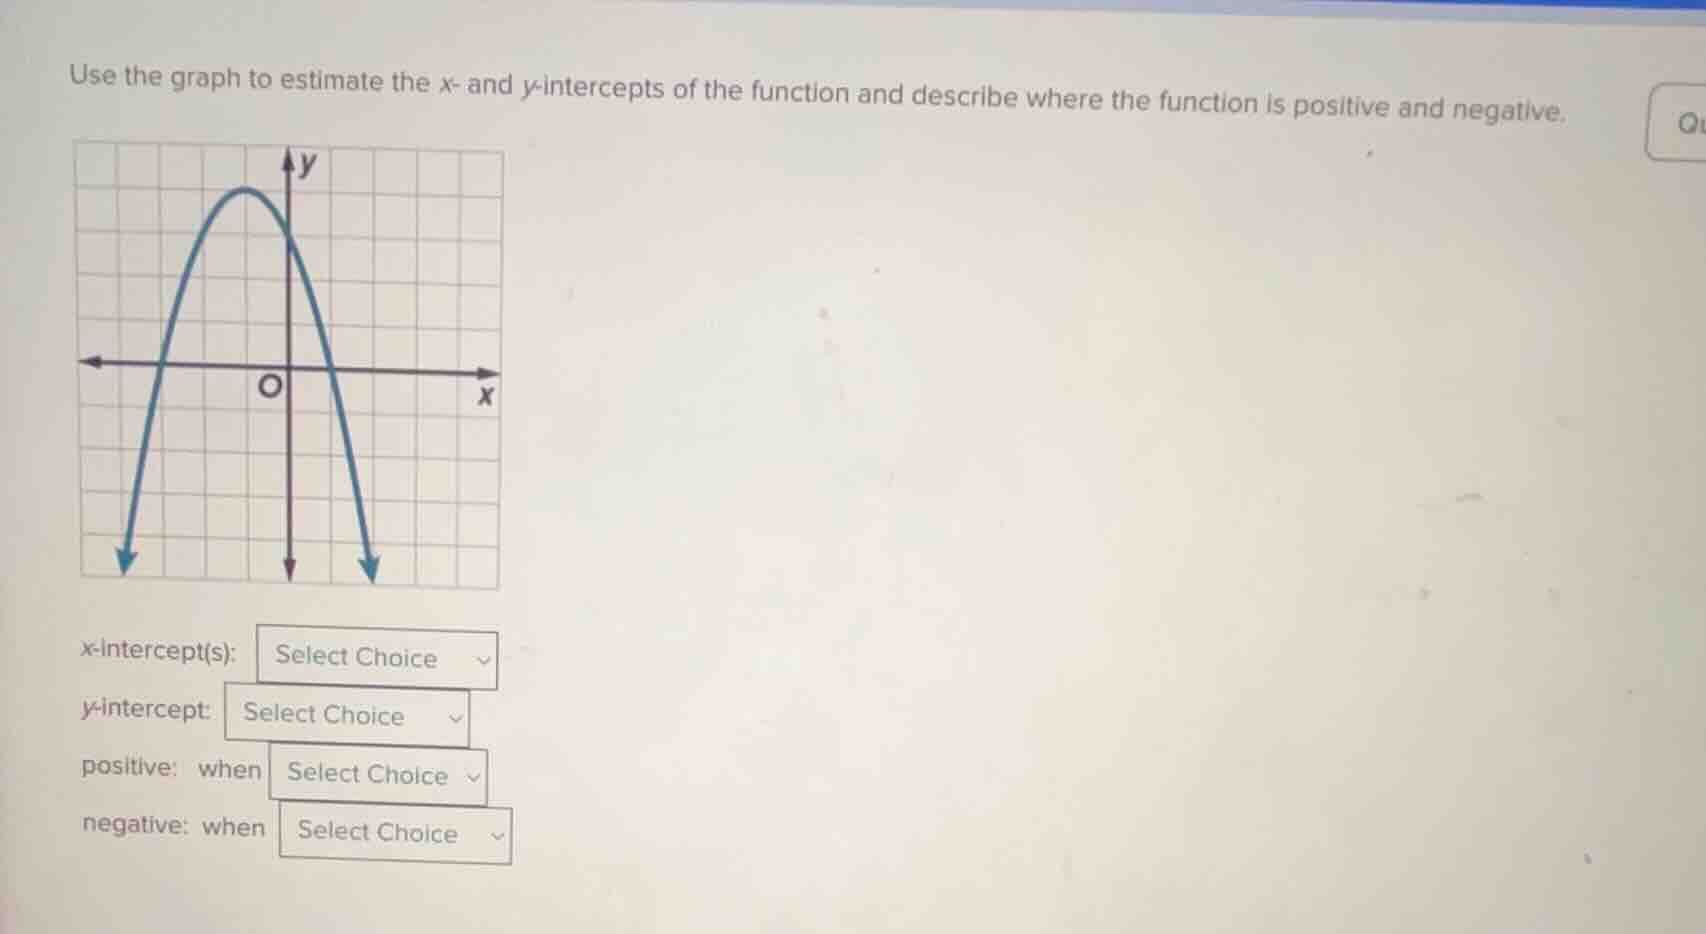
QUESTION IMAGE
Question
use the graph to estimate the x- and y-intercepts of the function and describe where the function is positive and negative.
x-intercept(s): select choice
y-intercept: select choice
positive: when select choice
negative: when select choice
Step1: Analyze x - intercepts
The x - intercepts are the points where the graph intersects the x - axis (where \(y = 0\)). From the graph, we can see that the parabola intersects the x - axis at \(x=-3\) and \(x = 1\) (assuming the grid has integer coordinates, by looking at the intersection points with the x - axis). So the x - intercepts are \((-3,0)\) and \((1,0)\).
Step2: Analyze y - intercept
The y - intercept is the point where the graph intersects the y - axis (where \(x = 0\)). From the graph, when \(x = 0\), the graph intersects the y - axis at \(y = 3\) (by looking at the intersection point with the y - axis). So the y - intercept is \((0,3)\).
Step3: Analyze where the function is positive
A function is positive when its graph is above the x - axis (\(y>0\)). From the graph, the parabola is above the x - axis between \(x=-3\) and \(x = 1\) (i.e., for \(-3 A function is negative when its graph is below the x - axis (\(y < 0\)). From the graph, the parabola is below the x - axis when \(x<-3\) or \(x>1\).Step4: Analyze where the function is negative

Snap & solve any problem in the app
Get step-by-step solutions on Sovi AI
Photo-based solutions with guided steps
Explore more problems and detailed explanations
x - intercept(s): \((-3,0)\) and \((1,0)\)
y - intercept: \((0,3)\)
positive: when \(-3 < x < 1\)
negative: when \(x < - 3\) or \(x>1\)