QUESTION IMAGE
Question
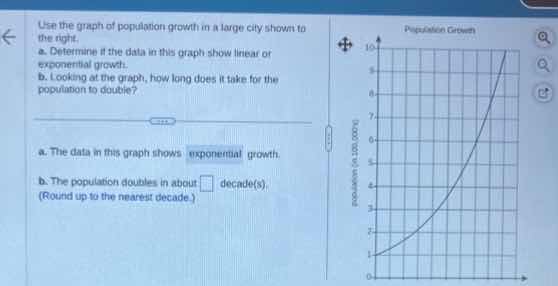
use the graph of population growth in a large city shown to the right.
a. determine if the data in this graph show linear or exponential growth.
b. looking at the graph, how long does it take for the population to double?
a. the data in this graph shows exponential growth.
b. the population doubles in about (square) decade(s).
(round up to the nearest decade.)
Part a
Step1: Recall growth types
Linear growth: constant slope (additive). Exponential: increasing slope (multiplicative, curve upward).
Step2: Analyze graph shape
The graph curves upward (not straight), so it’s exponential.
Step1: Identify initial population
From the graph, initial population (at start) is \(1\) (in 100,000s).
Step2: Find when population doubles
Doubled population is \(2\) (in 100,000s). Locate \(y = 2\) on the graph, check the \(x\)-axis (decades). The graph reaches \(y = 2\) at \(x\approx3\) decades (round up to nearest decade).

Snap & solve any problem in the app
Get step-by-step solutions on Sovi AI
Photo-based solutions with guided steps
Explore more problems and detailed explanations
exponential