QUESTION IMAGE
Question
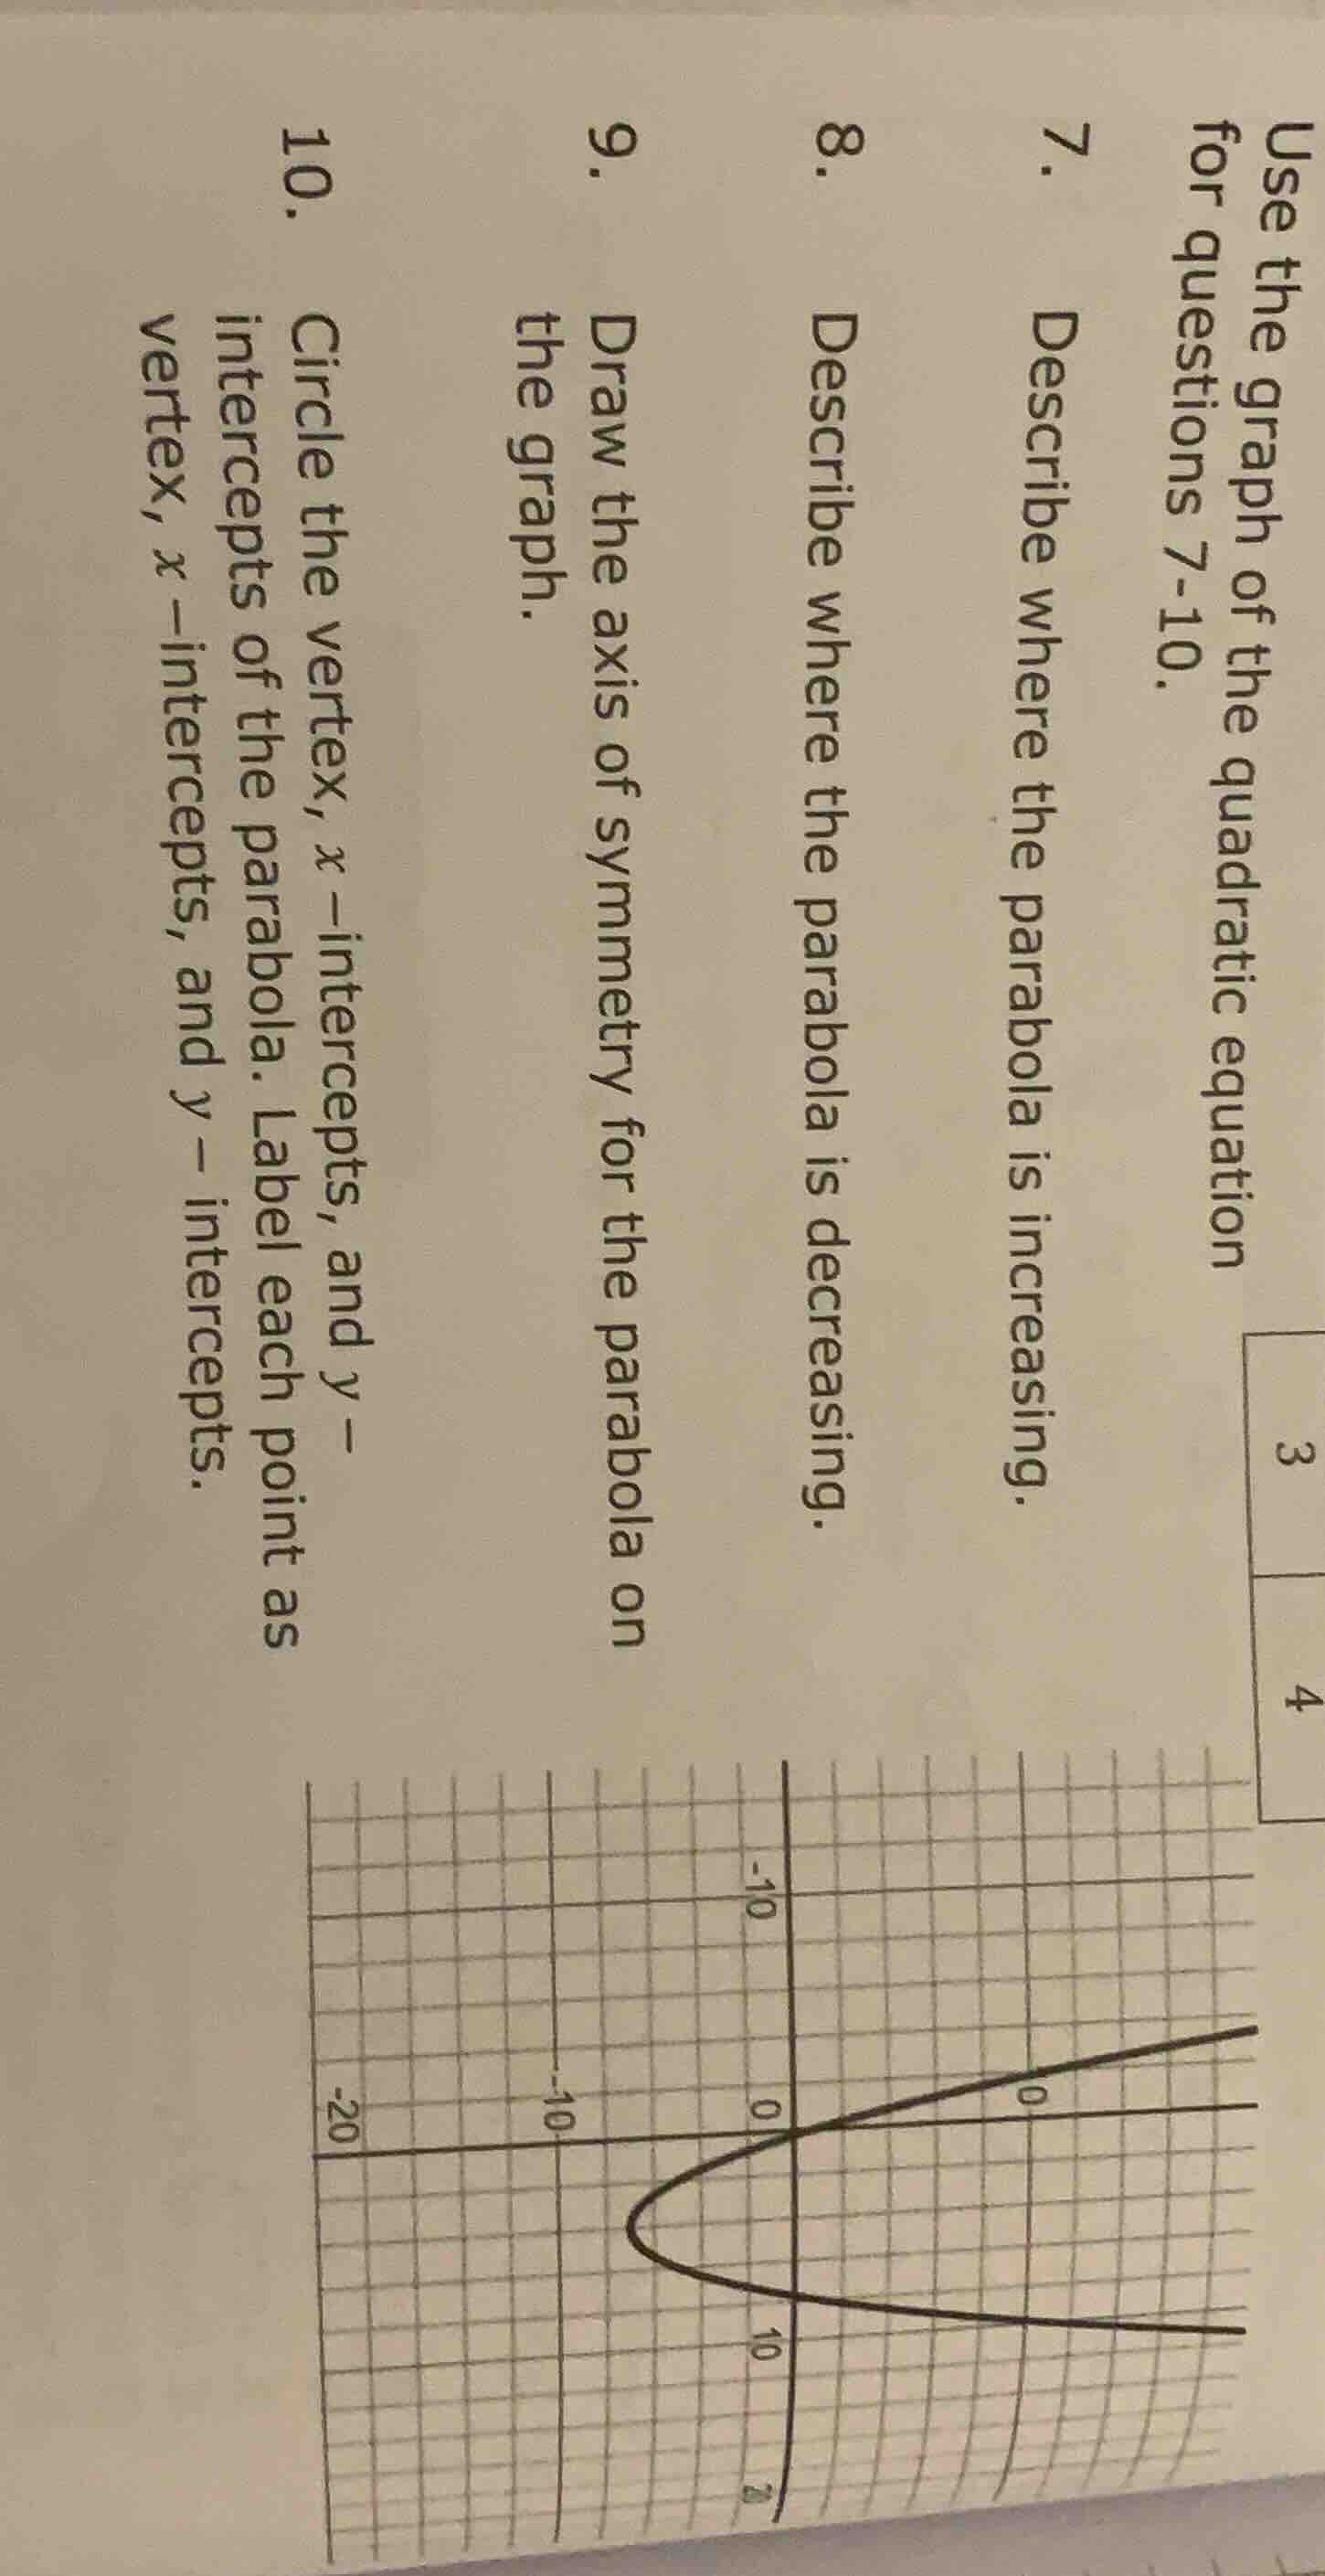
use the graph of the quadratic equation for questions 7-10.
- describe where the parabola is increasing.
- describe where the parabola is decreasing.
- draw the axis of symmetry for the parabola on the graph.
- circle the vertex, $x$-intercepts, and $y$-intercepts of the parabola. label each point as vertex, $x$-intercepts, and $y-$ intercepts.
Step1: Identify vertex x-coordinate
The vertex is at $x=-5$ (lowest point of parabola).
Step2: Define increasing interval
For $x > -5$, the parabola rises.
Step3: Define decreasing interval
For $x < -5$, the parabola falls.
Step4: Draw axis of symmetry
Axis of symmetry: $x=-5$ (vertical line through vertex).
Step5: Locate key points
Vertex: $(-5, -10)$
x-intercepts: $(-10, 0)$ and $(0, 0)$
y-intercept: $(0, 0)$

Snap & solve any problem in the app
Get step-by-step solutions on Sovi AI
Photo-based solutions with guided steps
Explore more problems and detailed explanations
- The parabola is increasing for $x > -5$ (all real numbers greater than -5).
- The parabola is decreasing for $x < -5$ (all real numbers less than -5).
- A vertical line $x=-5$ (drawn through the vertex of the parabola) is the axis of symmetry.
10.
- Vertex: $(-5, -10)$ (circled)
- x-intercepts: $(-10, 0)$ and $(0, 0)$ (circled)
- y-intercept: $(0, 0)$ (circled, same as one x-intercept)