QUESTION IMAGE
Question
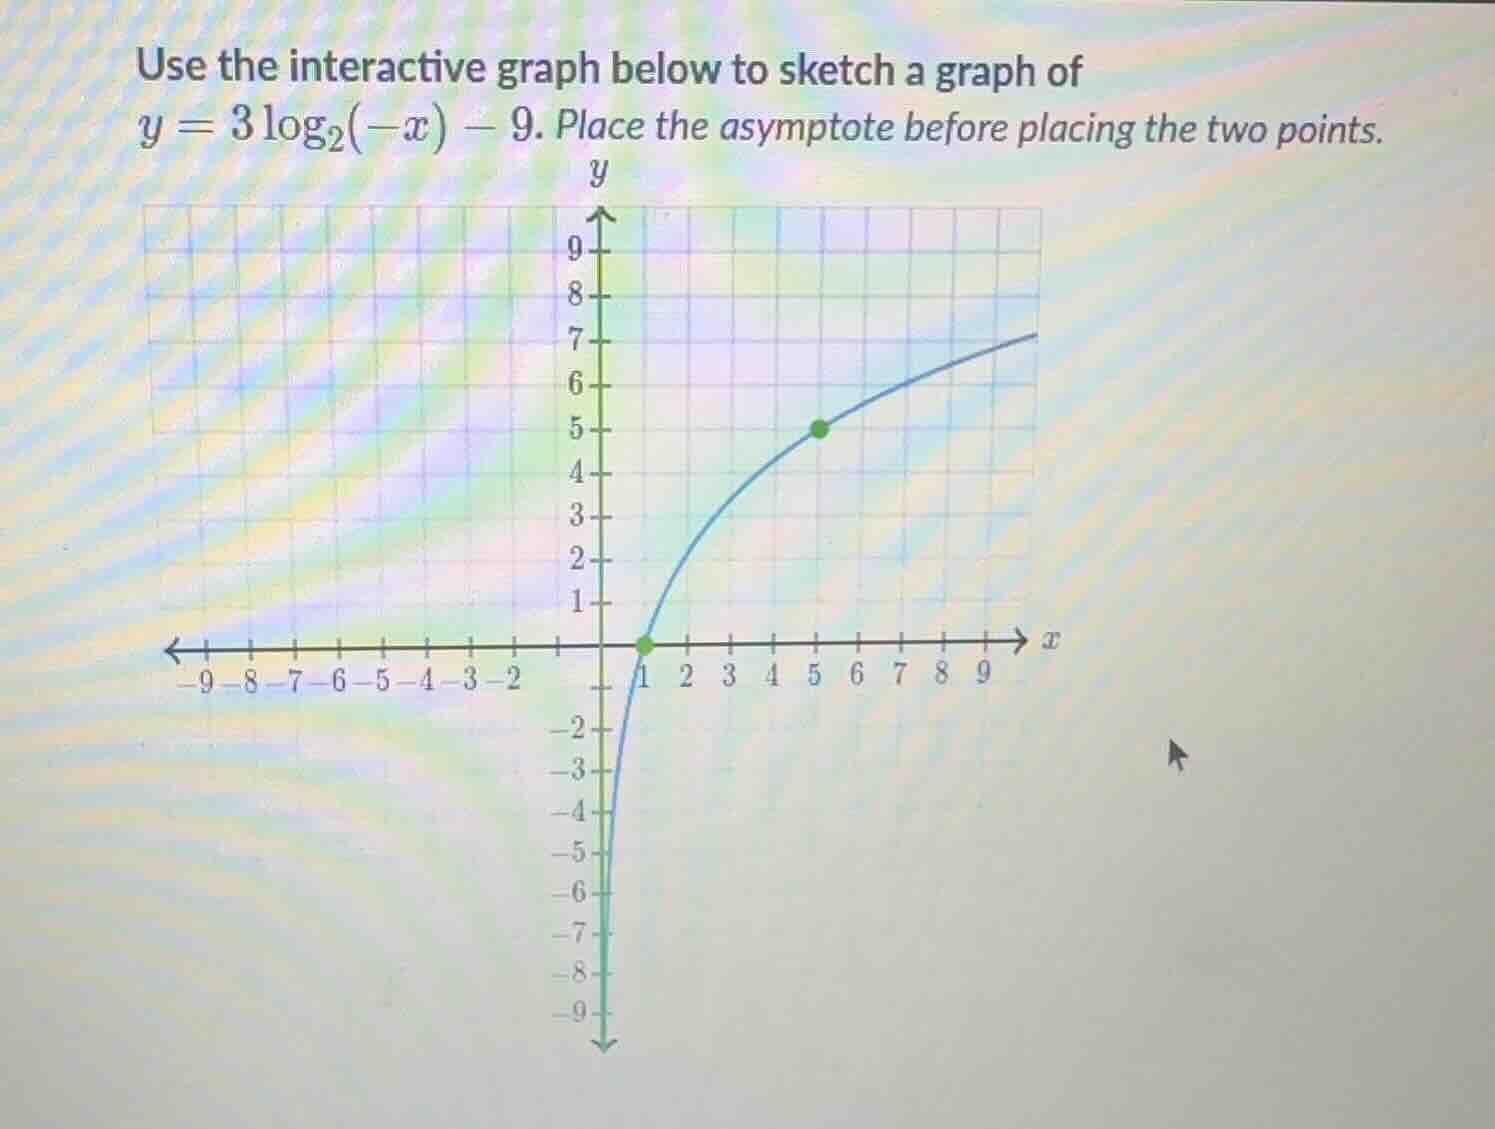
use the interactive graph below to sketch a graph of $y = 3\log_2(-x) - 9$. place the asymptote before placing the two points.
Step1: Find vertical asymptote
For $\log_b(u)$, asymptote at $u=0$. Here $u=-x$, so $-x=0 \implies x=0$.
Step2: Find point 1: set $-x=1$
$-x=1 \implies x=-1$. Substitute into $y$:
$y=3\log_2(1)-9 = 3(0)-9 = -9$.
Point: $(-1, -9)$
Step3: Find point 2: set $-x=2$
$-x=2 \implies x=-2$. Substitute into $y$:
$y=3\log_2(2)-9 = 3(1)-9 = -6$.
Point: $(-2, -6)$
Step4: Find point 3: set $-x=4$
$-x=4 \implies x=-4$. Substitute into $y$:
$y=3\log_2(4)-9 = 3(2)-9 = -3$.
Point: $(-4, -3)$

Snap & solve any problem in the app
Get step-by-step solutions on Sovi AI
Photo-based solutions with guided steps
Explore more problems and detailed explanations
- Vertical Asymptote: $x=0$ (the y-axis)
- Key points to plot: $(-1, -9)$, $(-2, -6)$ (or $(-4, -3)$)
- The graph is a reflected (over y-axis), vertically stretched (by factor 3), and vertically shifted down 9 units version of $\log_2(x)$, decreasing as $x$ approaches 0 from the left, and increasing as $x$ becomes more negative.