QUESTION IMAGE
Question
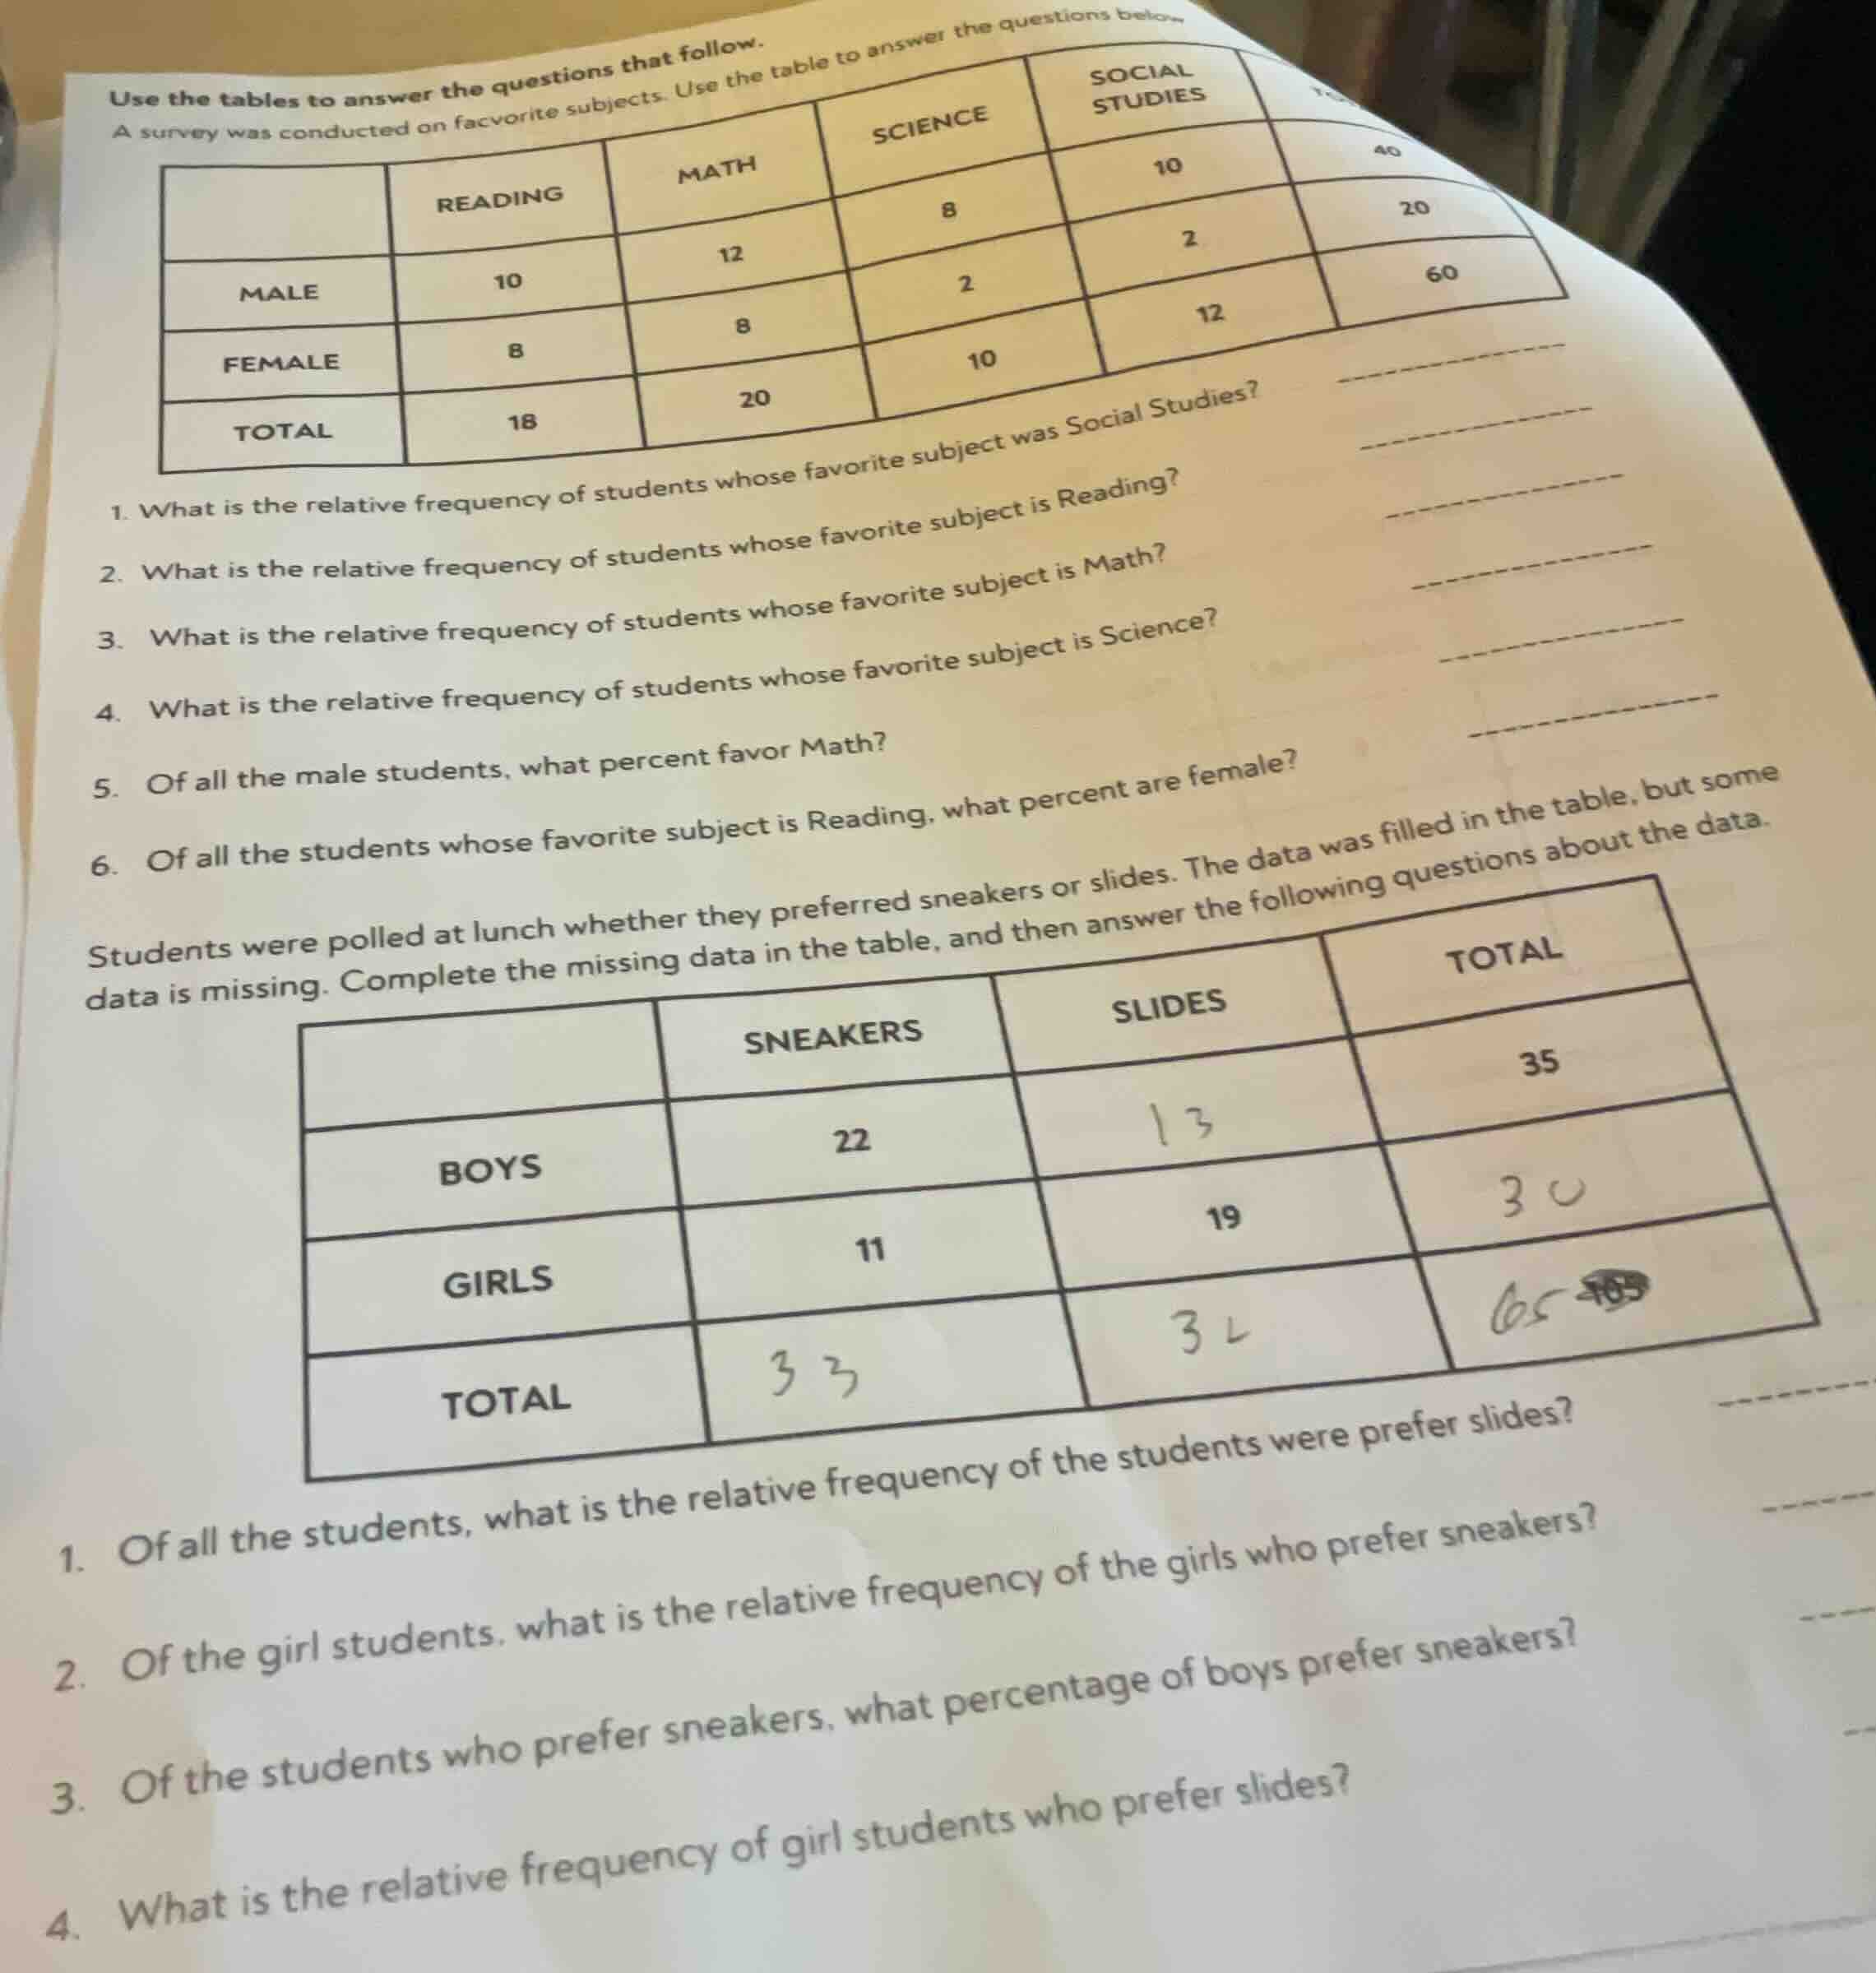
use the tables to answer the questions that follow.
a survey was conducted on favorite subjects. use the table to answer the questions below.
- what is the relative frequency of students whose favorite subject was social studies?
- what is the relative frequency of students whose favorite subject is reading?
- what is the relative frequency of students whose favorite subject is math?
- what is the relative frequency of students whose favorite subject is science?
- of all the male students, what percent favor math?
- of all the students whose favorite subject is reading, what percent are female?
students were polled at lunch whether they preferred sneakers or slides. the data was filled in the table, but some data is missing. complete the missing data in the table, and then answer the following questions about the data.
- of all the students, what is the relative frequency of the students were prefer slides?
- of the girl students, what is the relative frequency of the girls who prefer sneakers?
- of the students who prefer sneakers, what percentage of boys prefer sneakers?
- what is the relative frequency of girl students who prefer slides?
First Survey (Favorite Subjects)
Step1: Find total students
Total students = 60
Step2: Q1: Social Studies rel. freq.
Relative frequency = $\frac{\text{Social Studies total}}{\text{Total students}}$
$\frac{12}{60} = 0.2$
Step3: Q2: Reading rel. freq.
Relative frequency = $\frac{\text{Reading total}}{\text{Total students}}$
$\frac{18}{60} = 0.3$
Step4: Q3: Math rel. freq.
Relative frequency = $\frac{\text{Math total}}{\text{Total students}}$
$\frac{20}{60} \approx 0.333$
Step5: Q4: Science rel. freq.
Relative frequency = $\frac{\text{Science total}}{\text{Total students}}$
$\frac{10}{60} \approx 0.167$
Step6: Q5: Male % favor Math
% = $\frac{\text{Male Math}}{\text{Total Male}} \times 100$
$\frac{12}{40} \times 100 = 30\%$
Step7: Q6: Reading female %
% = $\frac{\text{Female Reading}}{\text{Total Reading}} \times 100$
$\frac{8}{18} \times 100 \approx 44.44\%$
Step1: Fill boys' slides
Boys slides = Total boys - Boys sneakers
$35 - 22 = 13$
Step2: Fill girls' total
Girls total = Girls sneakers + Girls slides
$11 + 19 = 30$
Step3: Fill total sneakers
Total sneakers = Boys sneakers + Girls sneakers
$22 + 11 = 33$
Step4: Fill total slides
Total slides = Boys slides + Girls slides
$13 + 19 = 32$
Step5: Fill total students
Total students = Total sneakers + Total slides
$33 + 32 = 65$
Step6: Q1: Slides rel. freq.
Relative frequency = $\frac{\text{Total slides}}{\text{Total students}}$
$\frac{32}{65} \approx 0.492$
Step7: Q2: Girls prefer sneakers rel. freq.
Relative frequency = $\frac{\text{Girls sneakers}}{\text{Total girls}}$
$\frac{11}{30} \approx 0.367$
Step8: Q3: Boys % prefer sneakers
% = $\frac{\text{Boys sneakers}}{\text{Total sneakers}} \times 100$
$\frac{22}{33} \times 100 \approx 66.67\%$
Step9: Q4: Girls prefer slides rel. freq.
Relative frequency = $\frac{\text{Girls slides}}{\text{Total girls}}$
$\frac{19}{30} \approx 0.633$
Completed Table:
| SNEAKERS | SLIDES | TOTAL | |
|---|---|---|---|
| GIRLS | 11 | 19 | 30 |
| TOTAL | 33 | 32 | 65 |

Snap & solve any problem in the app
Get step-by-step solutions on Sovi AI
Photo-based solutions with guided steps
Explore more problems and detailed explanations
- $0.2$
- $0.3$
- $\frac{1}{3} \approx 0.333$
- $\frac{1}{6} \approx 0.167$
- $30\%$
- $\approx 44.44\%$
---
Second Survey (Footwear Preference)
First, complete the table: