QUESTION IMAGE
Question
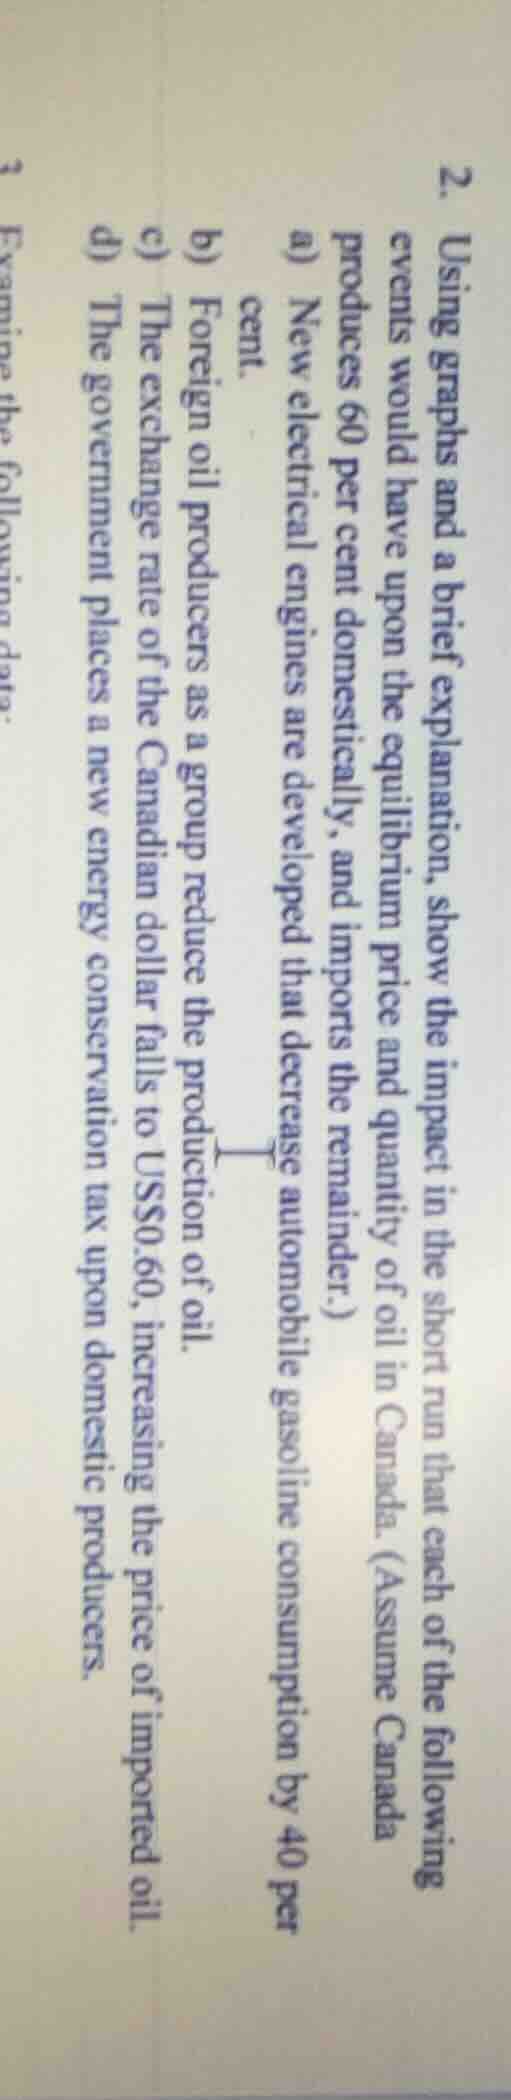
- using graphs and a brief explanation, show the impact in the short run that each of the following events would have upon the equilibrium price and quantity of oil in canada. (assume canada produces 60 per cent domestically, and imports the remainder.)
a) new electrical engines are developed that decrease automobile gasoline consumption by 40 per cent.
b) foreign oil producers as a group reduce the production of oil.
c) the exchange rate of the canadian dollar falls to us$0.60, increasing the price of imported oil.
d) the government places a new energy conservation tax upon domestic producers.
Part a)
New low-gas engines reduce gasoline demand, which is a complement to oil. This decreases the demand for oil in Canada. On a supply-demand graph, the demand curve shifts left. The new equilibrium has a lower price and lower quantity of oil.
Part b)
Foreign oil producers cutting output reduces the global supply of oil, which decreases the supply of imported oil (40% of Canada's oil). On the graph, the supply curve for Canadian oil shifts left. This leads to a higher equilibrium price and lower equilibrium quantity of oil in Canada.
Part c)
A weaker Canadian dollar raises the domestic price of imported oil, making imported oil more expensive. This decreases the supply of oil in Canada (since imports are part of total supply). The supply curve shifts left, causing a higher equilibrium price and lower equilibrium quantity of oil.
Part d)
A tax on domestic oil producers increases their production costs, reducing the quantity of domestic oil they supply at each price. The total supply curve for Canadian oil shifts left, resulting in a higher equilibrium price and lower equilibrium quantity of oil.

Snap & solve any problem in the app
Get step-by-step solutions on Sovi AI
Photo-based solutions with guided steps
Explore more problems and detailed explanations
Part a)
- Graph impact: Leftward shift of the oil demand curve.
- Outcome: Lower equilibrium price, lower equilibrium quantity of oil.
Part b)
- Graph impact: Leftward shift of the oil supply curve.
- Outcome: Higher equilibrium price, lower equilibrium quantity of oil.
Part c)
- Graph impact: Leftward shift of the oil supply curve.
- Outcome: Higher equilibrium price, lower equilibrium quantity of oil.
Part d)
- Graph impact: Leftward shift of the oil supply curve.
- Outcome: Higher equilibrium price, lower equilibrium quantity of oil.