QUESTION IMAGE
Question
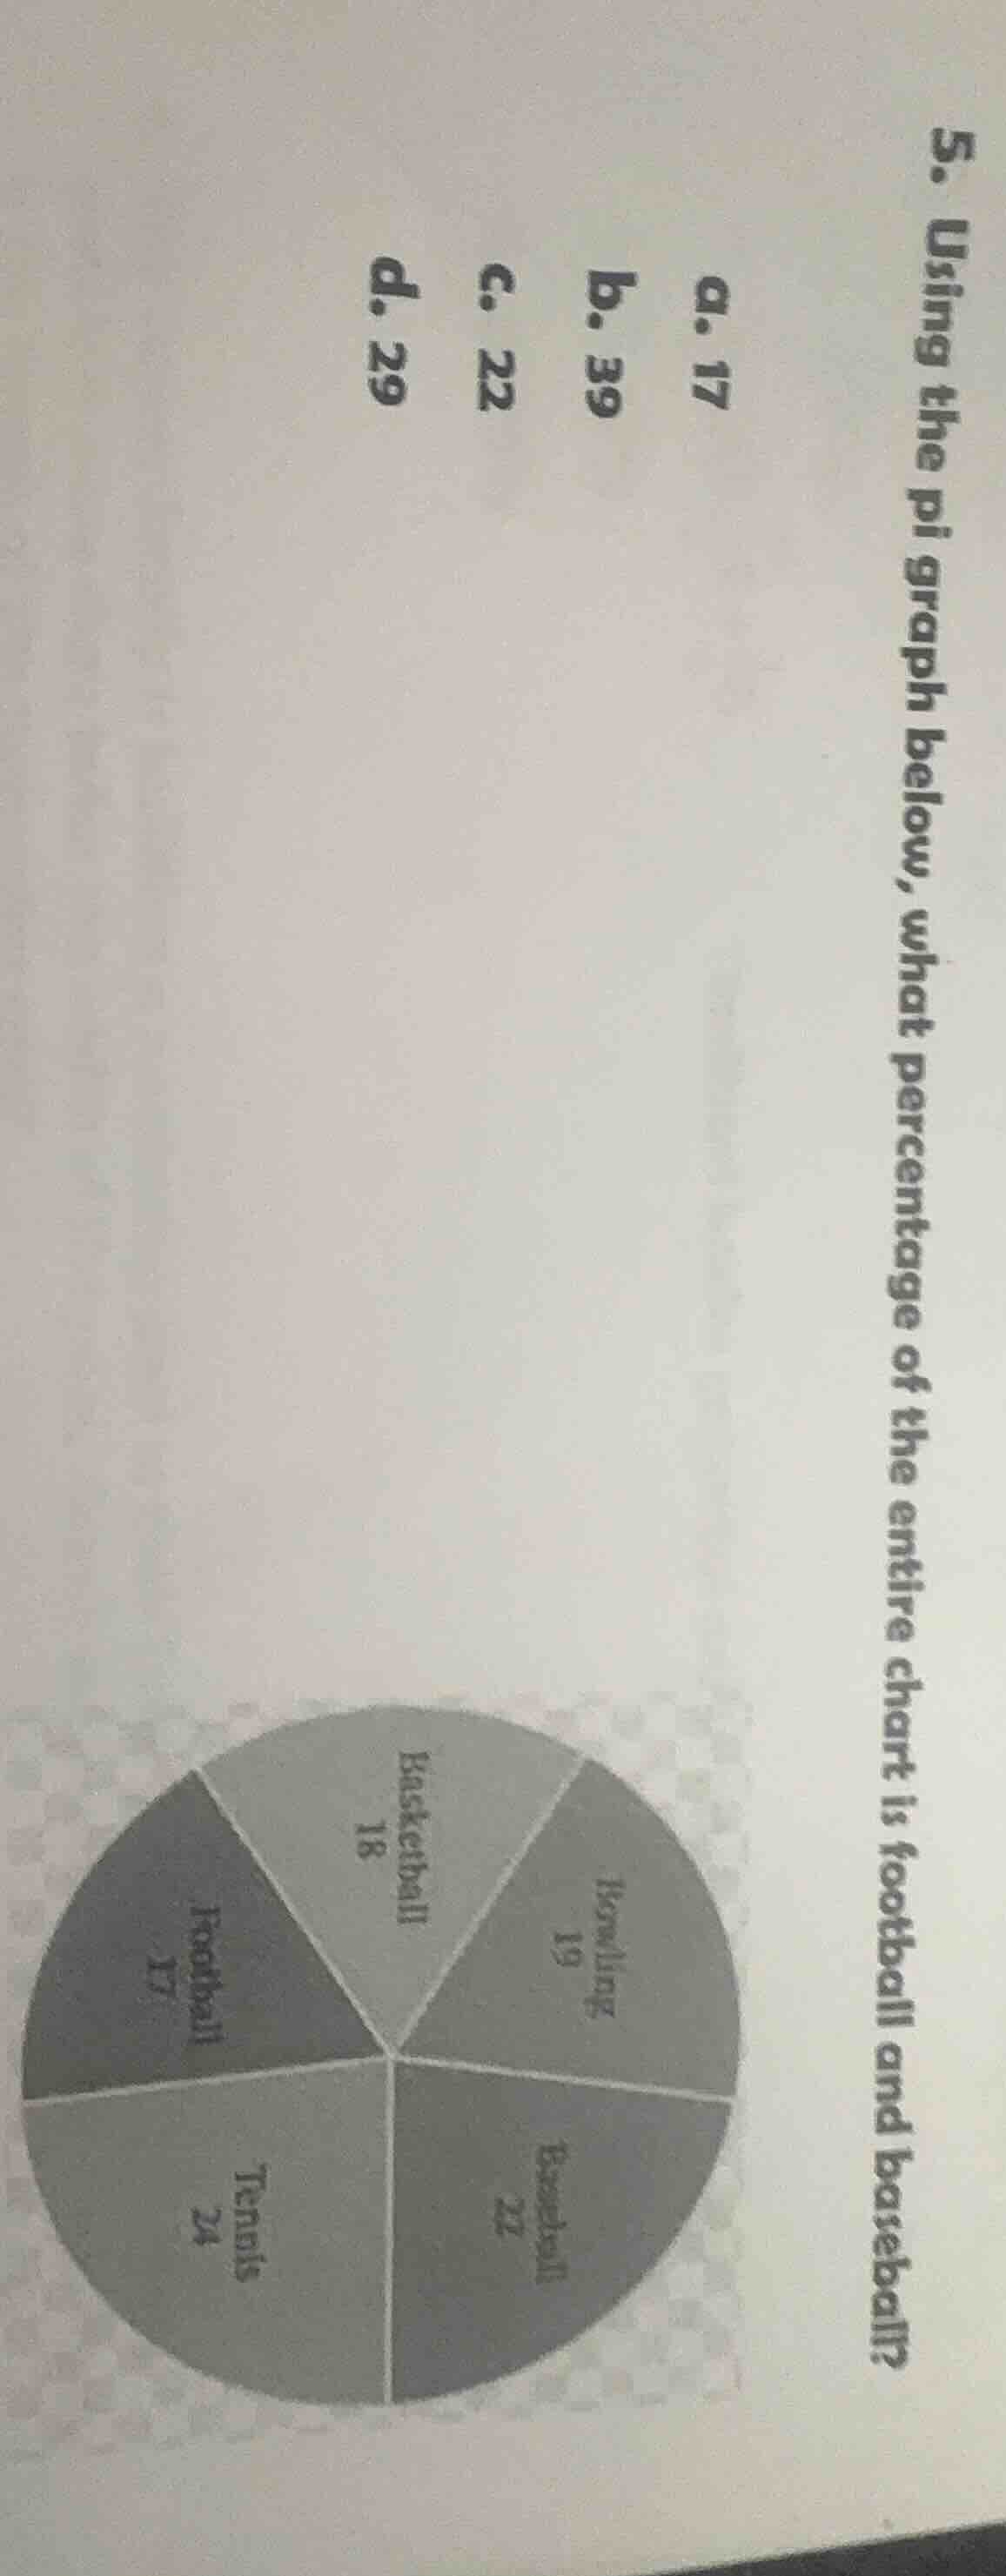
- using the pi graph below, what percentage of the entire chart is football and baseball?
a. 17
b. 39
c. 22
d. 29
pie chart with sections: football (17), basketball (18), bowling (19), baseball (22), tennis (24)
Step1: Find football and baseball values
Football: 17, Baseball: 22
Step2: Add the two values
$17 + 22 = 39$? Wait, no, wait. Wait, the total of all parts? Wait, no, the question is about the percentage of football and baseball in the entire chart. Wait, first, let's check the total of all sections. Wait, the pie chart has Bowling (19), Baseball (22), Tennis (24), Football (17), Basketball (18). Let's sum all: 19 + 22 + 24 + 17 + 18 = 100. Oh, so each number is the percentage. So football is 17, baseball is 22. So 17 + 22 = 39? Wait, but the options have b.39. Wait, but wait, maybe I misread. Wait, football is 17, baseball is 22. 17 + 22 = 39. So the answer is 39.
Wait, let's recalculate the total: 19 (Bowling) + 22 (Baseball) + 24 (Tennis) + 17 (Football) + 18 (Basketball) = 19+22=41, 41+24=65, 65+17=82, 82+18=100. Yes, total is 100, so each number is the percentage. So football is 17%, baseball is 22%. So 17 + 22 = 39%. So the answer is 39.

Snap & solve any problem in the app
Get step-by-step solutions on Sovi AI
Photo-based solutions with guided steps
Explore more problems and detailed explanations
b. 39