QUESTION IMAGE
Question
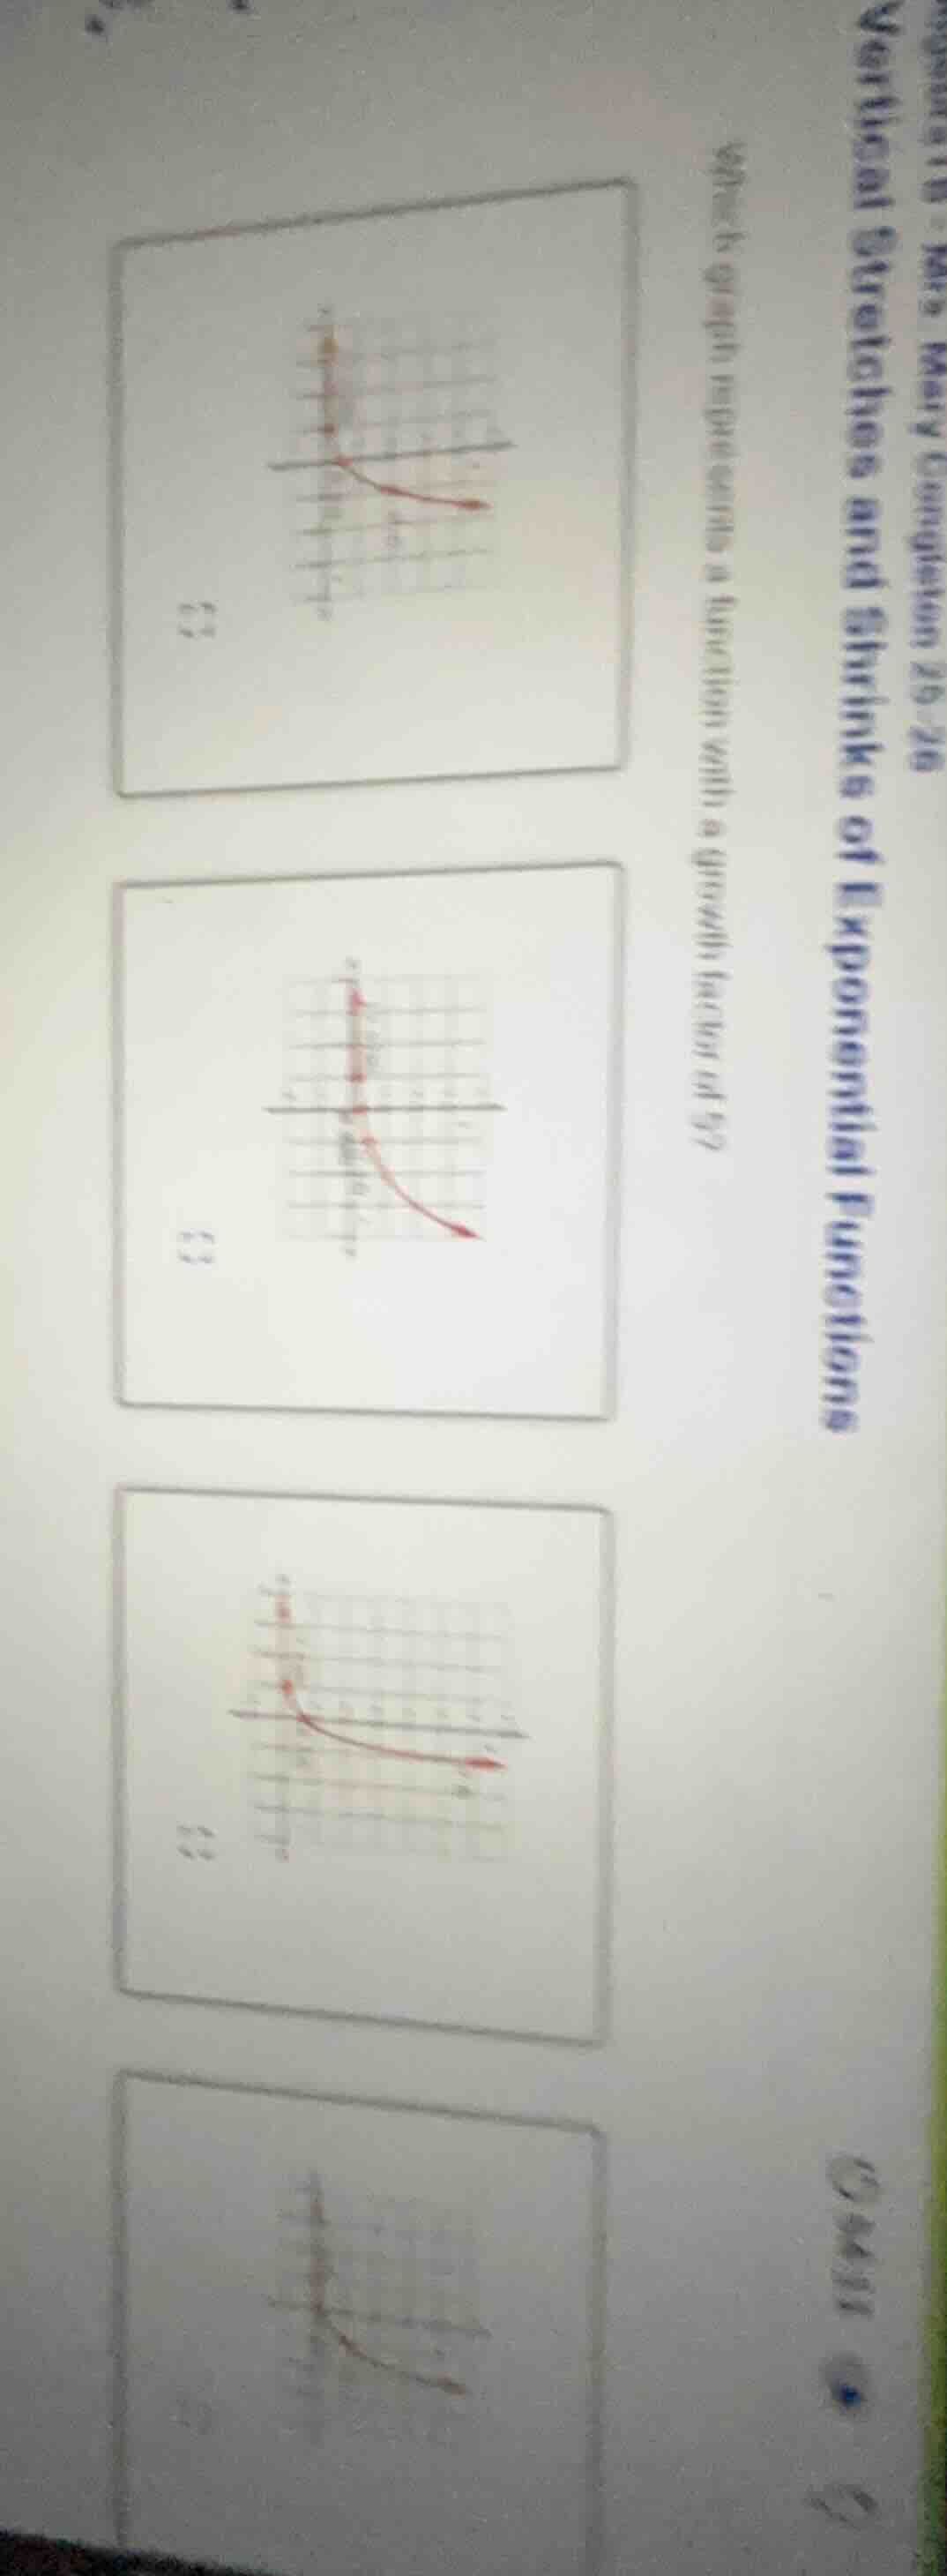
vertical stretches and shrinks of exponential functions
which graph represents a function with a growth factor of \\(\frac{1}{2}\\)?
Step1: Recall growth factor definition
An exponential function with growth factor $b>1$ increases as $x$ increases, and has the form $y=a(b)^x$ where $b=2$ here. Functions with $0 The top two graphs decrease as $x$ increases, so they represent decay (growth factor between 0 and 1), not growth. For $y=a(2)^x$, when $x$ increases by 1, $y$ doubles. The third graph (bottom of the visible growing graphs) shows increasing values that grow at a rate consistent with doubling, matching a growth factor of 2. The bottom-most graph appears to grow too slowly (likely a smaller growth factor or decay).Step2: Eliminate decay graphs
Step3: Verify growth graph behavior

Snap & solve any problem in the app
Get step-by-step solutions on Sovi AI
Photo-based solutions with guided steps
Explore more problems and detailed explanations
The third graph (the lower of the two upward-sloping exponential curves, labeled with the top-most of the two bottom option markers)