QUESTION IMAGE
Question
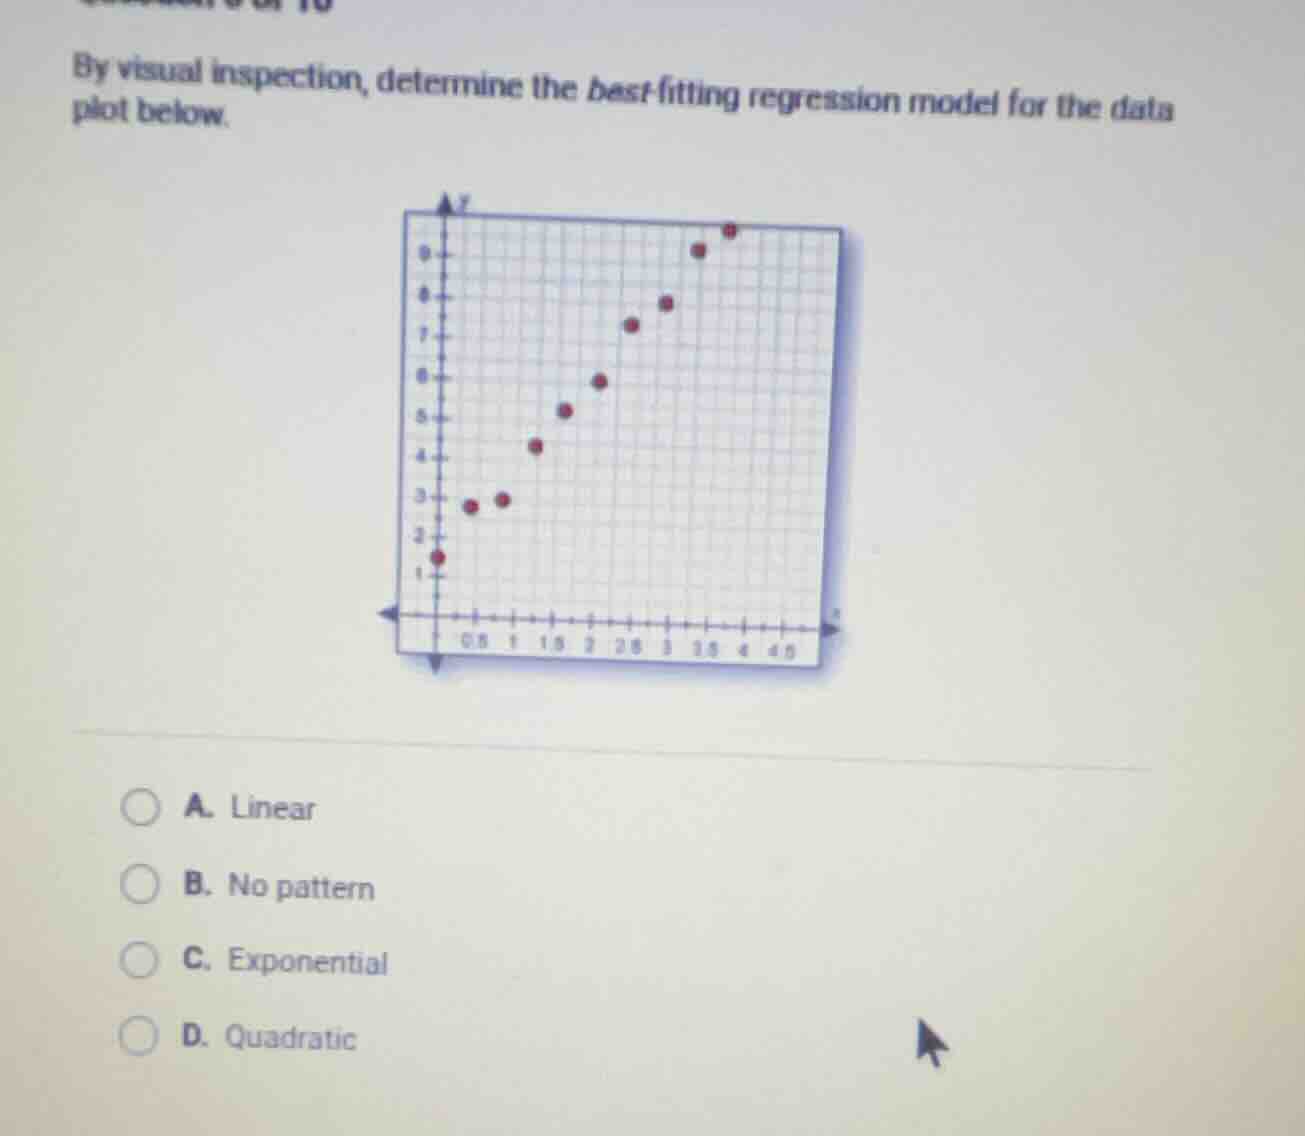
by visual inspection, determine the best-fitting regression model for the data plot below.
a. linear
b. no pattern
c. exponential
d. quadratic
The data points show an increasing trend where the rate of y-value increase slows as x increases, matching the shape of a logarithmic growth or a quadratic model that curves upward but flattens? No, correction: Wait, the points start with steep increase then the slope decreases, which is the reverse of exponential (which gets steeper). A quadratic model (opening downward would peak, but this is opening upward? No, wait, no: a quadratic model $y=ax^2+bx+c$ with a positive a curves upward, but the slope increases. Wait, no, the points here: as x increases, y increases but the difference between consecutive y-values gets smaller: from x=0 (y=1), x=0.5 (y=2.8), x=1 (y=3), x=1.5 (y=4.2), x=2 (y=5.2), x=2.5 (y=6), x=3 (y=7.2), x=3.5 (y=7.8), x=4 (y=9), x=4.5 (y=9.2). The growth rate slows, which is characteristic of a logarithmic model, but that's not an option. Wait, no, linear would have constant slope, which this does not. Exponential would have increasing slope. Quadratic: if it's a quadratic that is concave down, but that would peak. Wait no, wait the other way: the points fit a quadratic model that is concave up? No, no, wait the correct observation: the points form a curve that starts steep and then flattens, which is the inverse of exponential. But among the options, the best fit is quadratic? No, wait no—wait, no, linear is straight line, which this is not. Exponential is increasing slope, which this is not. No pattern is wrong, there is a clear pattern. Quadratic: a quadratic model can have a curve that first increases then the slope decreases (if it's a downward opening parabola, but that would have a maximum, which this doesn't reach yet). Wait, no, actually, the points are best fit by a quadratic model? No, wait no—wait, no, let's re-examine: the points show that as x increases, y increases, but the rate of increase (the slope between consecutive points) decreases: from x0 to x0.5: slope (2.8-1)/0.5=3.6; x0.5 to x1: (3-2.8)/0.5=0.4; x1 to x1.5: (4.2-3)/0.5=2.4; x1.5 to x2: (5.2-4.2)/0.5=2; x2 to x2.5: (6-5.2)/0.5=1.6; x2.5 to x3: (7.2-6)/0.5=2.4; x3 to x3.5: (7.8-7.2)/0.5=1.2; x3.5 to x4: (9-7.8)/0.5=2.4; x4 to x4.5: (9.2-9)/0.5=0.4. Wait, maybe I misread the points. Alternatively, the visual shape is a curve that is concave down, which is a quadratic model (with negative coefficient on x²). Yes, that fits. Wait no, linear is straight, which this is not. Exponential is concave up (increasing slope). So the best fit is quadratic.
Wait no, wait another way: linear regression is straight line, the points are not on a straight line. Exponential would have y increasing faster as x increases, but here y increases but the pace slows. So quadratic is the best option among the choices.

Snap & solve any problem in the app
Get step-by-step solutions on Sovi AI
Photo-based solutions with guided steps
Explore more problems and detailed explanations
D. Quadratic