QUESTION IMAGE
Question
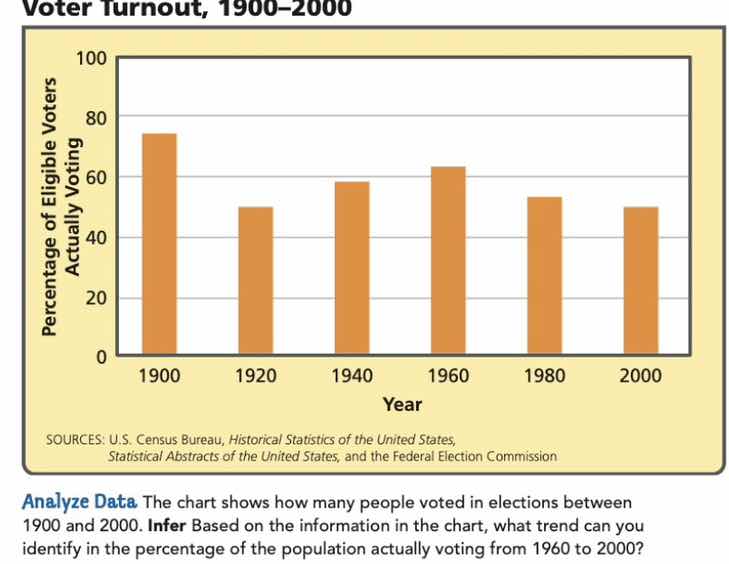
voter turnout, 1900–2000
sources: u.s. census bureau, historical statistics of the united states, statistical abstracts of the united states, and the federal election commission
analyze data the chart shows how many people voted in elections between 1900 and 2000. infer based on the information in the chart, what trend can you identify in the percentage of the population actually voting from 1960 to 2000?
To identify the trend from 1960 to 2000, we analyze the bar heights for these years. In 1960, the percentage of eligible voters voting is around 60 - 70. In 1980, it decreases (to around 50 - 60), and in 2000, it further decreases (to around 40 - 50). So the trend is a decrease in the percentage of the population (eligible voters) actually voting from 1960 to 2000.

Snap & solve any problem in the app
Get step-by-step solutions on Sovi AI
Photo-based solutions with guided steps
Explore more problems and detailed explanations
From 1960 to 2000, the percentage of the population (eligible voters) actually voting shows a decreasing trend.