QUESTION IMAGE
Question
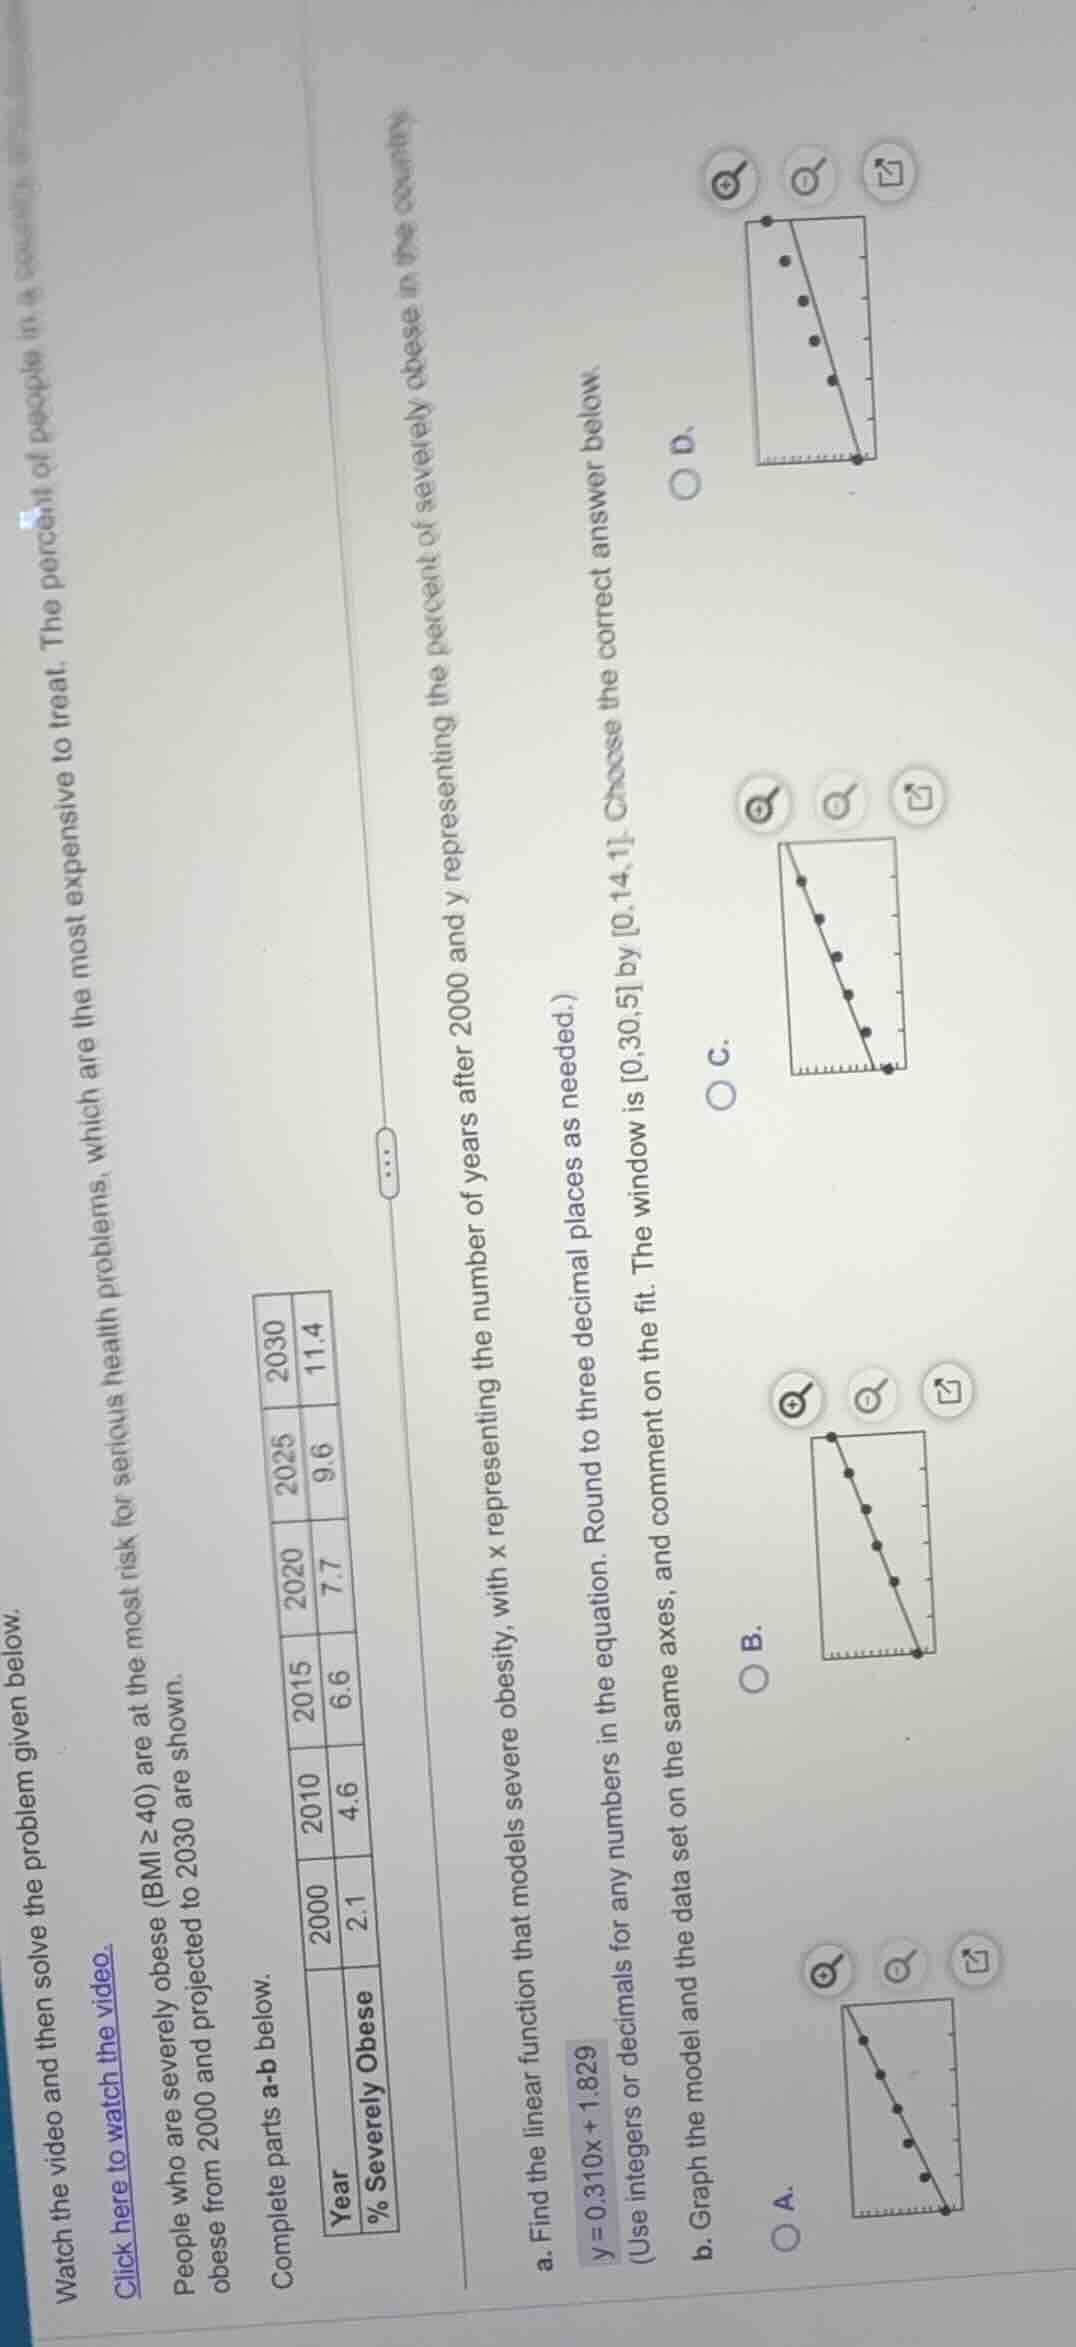
watch the video and then solve the problem given below. click here to watch the video. people who are severely obese (bmi ≥ 40) are at the most risk for serious health problems, which are the most expensive to treat. the percent of people in a... complete parts a - b below.
| year | % severely obese |
|---|---|
| 2010 | 4.6 |
| 2015 | 6.6 |
| 2020 | 7.7 |
| 2025 | 9.6 |
| 2030 | 11.4 |
a. find the linear function that models severe obesity, with x representing the number of years after 2000 and y representing the percent of severely obese in the country. y = 0.310x + 1.829 (use integers or decimals for any numbers in the equation. round to three decimal places as needed.)
b. graph the model and the data set on the same axes, and comment on the fit. the window is 0, 30, 5 by 0, 14, 1. choose the correct answer below.
a.
b.
c.
d.
Step1: Verify linear function fit
We check the given linear model $y = 0.310x + 1.829$ against the data:
- For 2000 ($x=0$): $y=0.310(0)+1.829=1.829 \approx 2.1$
- For 2010 ($x=10$): $y=0.310(10)+1.829=4.929 \approx 4.6$
- For 2020 ($x=20$): $y=0.310(20)+1.829=8.029 \approx 7.7$
- For 2030 ($x=30$): $y=0.310(30)+1.829=11.129 \approx 11.4$
The line should increase from left to right, with data points close to the line. Graph A shows points closely following an increasing line matching this trend.

Snap & solve any problem in the app
Get step-by-step solutions on Sovi AI
Photo-based solutions with guided steps
Explore more problems and detailed explanations
a. $y = 0.310x + 1.829$
b. A. (The graph with data points closely following an upward-sloping line, matching the linear model's trend, indicating a good fit between the model and the data.)