QUESTION IMAGE
Question
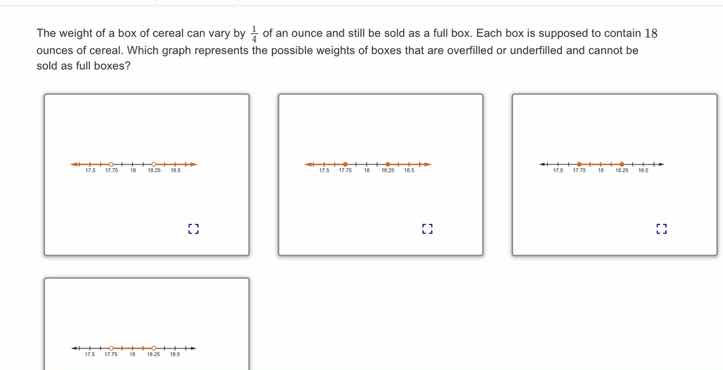
the weight of a box of cereal can vary by \\(\frac{1}{4}\\) of an ounce and still be sold as a full box. each box is supposed to contain 18 ounces of cereal. which graph represents the possible weights of boxes that are overfilled or underfilled and cannot be sold as full boxes?
Step1: Determine the acceptable weight range
The target weight is 18 ounces, and the variation allowed is \(\frac{1}{4}\) ounce. So the acceptable range is \(18 - \frac{1}{4}\) to \(18 + \frac{1}{4}\). Calculate \(18 - \frac{1}{4}=\frac{72 - 1}{4}=\frac{71}{4} = 17.75\) and \(18+\frac{1}{4}=\frac{72 + 1}{4}=\frac{73}{4}=18.25\). So boxes with weight less than 17.75 ounces or more than 18.25 ounces cannot be sold as full.
Step2: Analyze the number lines
We need a number line that shows the regions outside \(17.75\) and \(18.25\). The correct graph should have open circles (since the endpoints are not included, as the variation is "can vary by \(\frac{1}{4}\) and still be sold") at \(17.75\) and \(18.25\), and the shaded regions should be to the left of \(17.75\) and to the right of \(18.25\).

Snap & solve any problem in the app
Get step-by-step solutions on Sovi AI
Photo-based solutions with guided steps
Explore more problems and detailed explanations
The graph with open circles at \(17.75\) (or \(17\frac{3}{4}\)) and \(18.25\) (or \(18\frac{1}{4}\)) and shaded regions outside this interval (left of \(17.75\) and right of \(18.25\)) represents the possible weights of boxes that cannot be sold as full. Typically, this would be a number line where the segments less than \(17.75\) and greater than \(18.25\) are highlighted (e.g., the third graph in the initial set, assuming standard representations where the non - acceptable regions are shaded outside the \(17.75 - 18.25\) interval with open circles at the bounds).