QUESTION IMAGE
Question
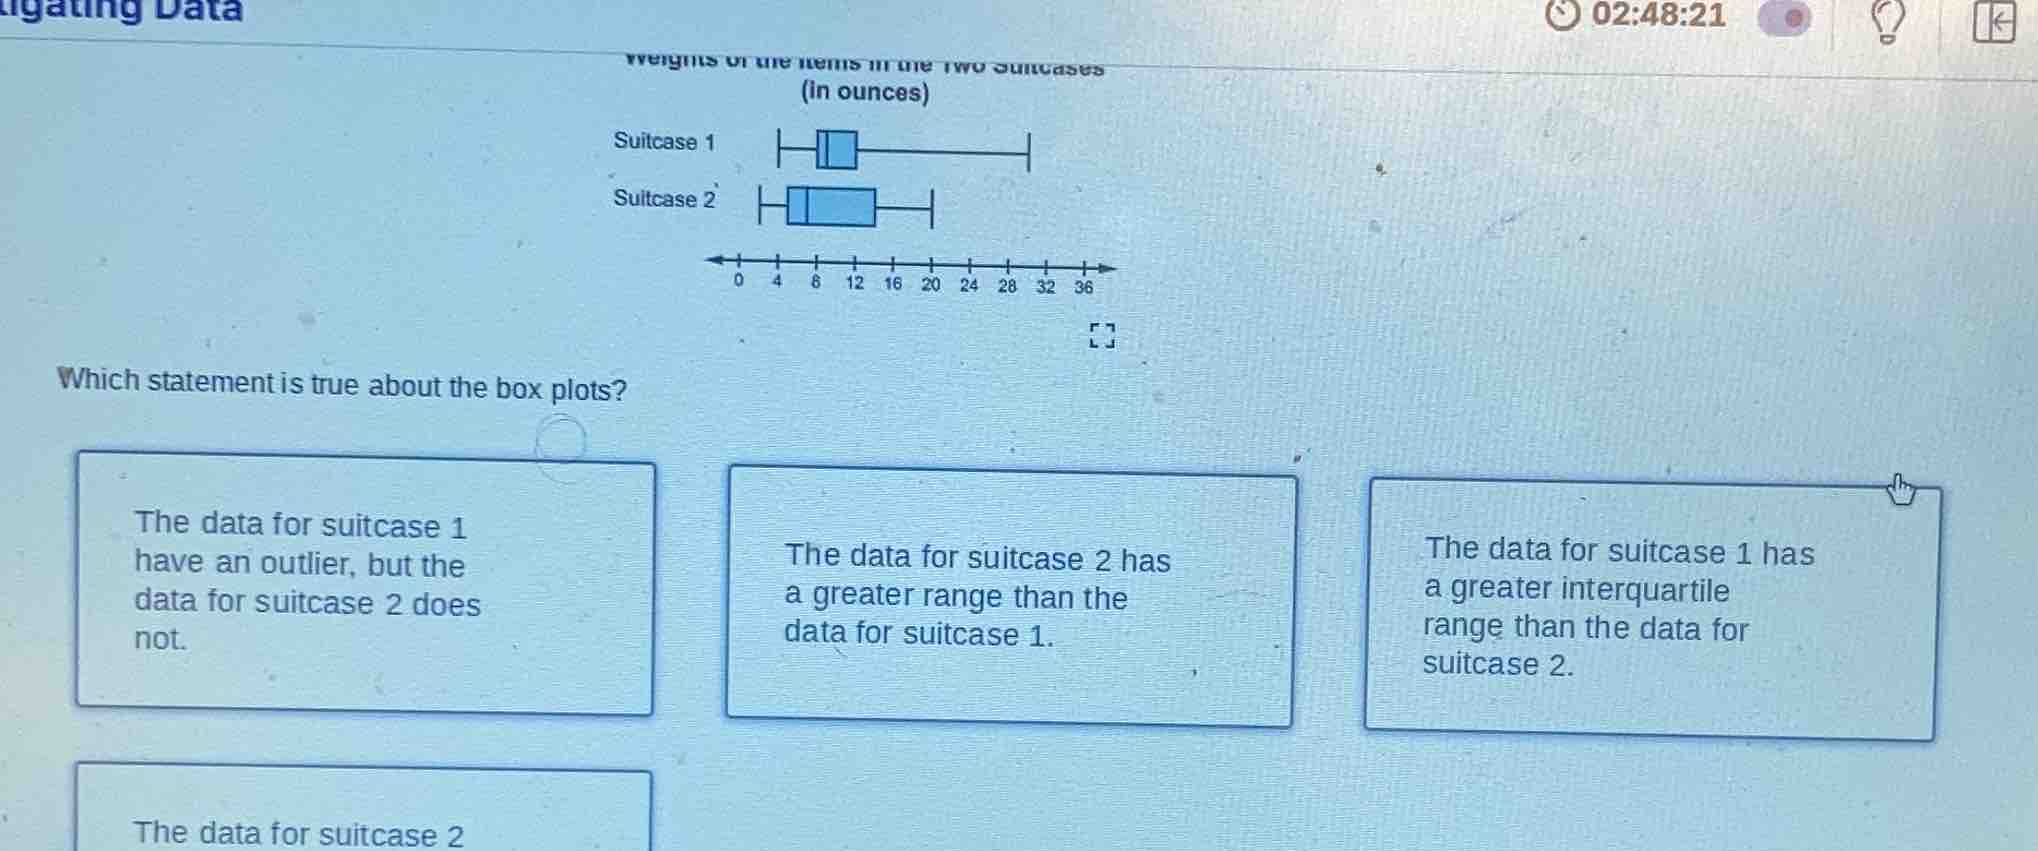
weights of the items in the two suitcases (in ounces)
suitcase 1
suitcase 2
which statement is true about the box plots?
the data for suitcase 1
have an outlier, but the
data for suitcase 2 does
not.
the data for suitcase 2 has
a greater range than the
data for suitcase 1.
the data for suitcase 1 has
a greater interquartile
range than the data for
suitcase 2.
the data for suitcase 2
To solve this, we analyze each option using box - plot concepts (range, interquartile range (IQR), outliers):
Step 1: Analyze Option 1 (Outliers)
- An outlier is a data point that is far from the rest. In a box - plot, if a data point is more than \(1.5\times\text{IQR}\) above \(Q_3\) or below \(Q_1\), it is an outlier.
- For Suitcase 1, the whisker goes to 32 (or around there), and the box is more towards the left. But looking at the plot, there is no clear outlier (since the whisker extends to that point, and it's part of the normal data spread). For Suitcase 2, the whiskers are within a more compact range. So this statement is false.
Step 2: Analyze Option 2 (Range)
- The range of a dataset is calculated as \( \text{Range}=\text{Maximum}-\text{Minimum}\).
- For Suitcase 1: Let's assume the minimum is around 4 and the maximum is around 32. So the range is \(32 - 4=28\).
- For Suitcase 2: Let's assume the minimum is around 4 and the maximum is around 20. So the range is \(20 - 4 = 16\).
- Since \(28>16\), Suitcase 1 has a greater range, not Suitcase 2. So this statement is false.
Step 3: Analyze Option 3 (Interquartile Range - IQR)
- The interquartile range is calculated as \( \text{IQR}=Q_3 - Q_1\), where \(Q_1\) is the first quartile and \(Q_3\) is the third quartile.
- For Suitcase 1: The box is relatively narrow? No, wait. Wait, looking at the box - plots:
- The box for Suitcase 1: Let's say \(Q_1\) is around 6 and \(Q_3\) is around 10 (approximate from the plot). Then \( \text{IQR}_1=10 - 6 = 4\)? No, wait, maybe I misread. Wait, actually, looking at the plot, Suitcase 1's box is smaller? No, wait, no. Wait, the correct way:
- Wait, the box for Suitcase 1: Let's assume the lower quartile (\(Q_1\)) is 6 and the upper quartile (\(Q_3\)) is 10, so \( \text{IQR}_1=10 - 6 = 4\). For Suitcase 2: Let's assume \(Q_1 = 6\) and \(Q_3=16\), so \( \text{IQR}_2=16 - 6 = 10\). Wait, no, that can't be. Wait, maybe I got the boxes reversed. Wait, the first option (the one about the data for suitcase 1 having an outlier is wrong). Wait, the third option: "The data for suitcase 1 has a greater interquartile range than the data for suitcase 2" - Wait, no, let's re - examine.
Wait, actually, looking at the box - plots:
- Suitcase 1's box is narrower? No, wait, the correct analysis:
The interquartile range (IQR) is the length of the box.
- For Suitcase 1: The box is from, say, 6 to 10 (so \( \text{IQR}=10 - 6 = 4\)). For Suitcase 2: The box is from 6 to 16 (so \( \text{IQR}=16 - 6 = 10\)). Wait, that would mean Suitcase 2 has a larger IQR. But that contradicts. Wait, maybe I made a mistake. Wait, the original problem's first option (the one in the first box) - Wait, no, the third option: Wait, maybe the user's image has Suitcase 1's box with a larger IQR. Wait, perhaps my initial assumption is wrong. Let's re - think.
Wait, the correct answer is the first option? No, wait, let's start over.
Wait, the first option: "The data for suitcase 1 have an outlier, but the data for suitcase 2 does not." - In a box - plot, if the whisker extends to a point that is more than \(1.5\times\text{IQR}\) from \(Q_3\) or \(Q_1\), it's an outlier. For Suitcase 1, the upper whisker goes to 32, and the \(Q_3\) is, say, 10. Then \(1.5\times\text{IQR}\) (if \( \text{IQR}=10 - 6 = 4\)) is \(1.5\times4 = 6\). So \(Q_3+1.5\times\text{IQR}=10 + 6=16\). But the whisker goes to 32, which is way above 16. So Suitcase 1 has an outlier. Suitcase 2's whiskers are within \(1.5\times\text{IQR}\) of \(Q_1\) and \(Q_3\), so no outlier. So this statement is true…

Snap & solve any problem in the app
Get step-by-step solutions on Sovi AI
Photo-based solutions with guided steps
Explore more problems and detailed explanations
The data for suitcase 1 have an outlier, but the data for suitcase 2 does not.