QUESTION IMAGE
Question
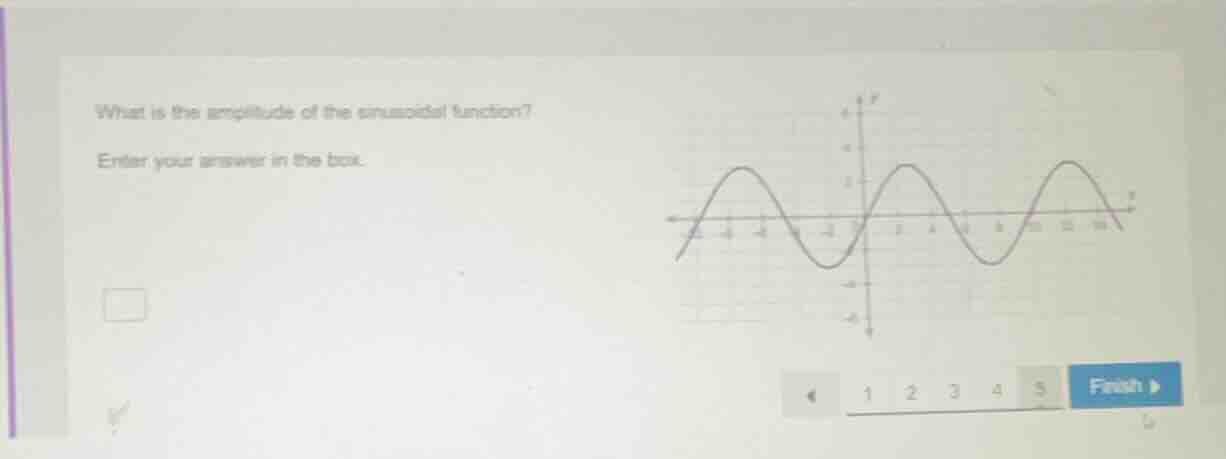
what is the amplitude of the sinusoidal function? enter your answer in the box.
Step1: Recall amplitude definition
Amplitude of a sinusoidal function is the maximum distance from the midline (average of maximum and minimum values) to a peak (or trough). It's calculated as $\frac{\text{Max value}-\text{Min value}}{2}$.
Step2: Identify max and min from graph
From the graph, the maximum value (peak) of the sinusoidal function is 3 (since it reaches up to y = 3) and the minimum value (trough) is -3 (reaches down to y = -3).
Step3: Calculate amplitude
Using the formula, amplitude = $\frac{3 - (-3)}{2}=\frac{6}{2} = 3$. Wait, no, wait. Wait, looking at the graph again, maybe I misread. Wait, the y - axis has marks. Wait, the peak is at y = 3? Wait, no, maybe the distance from the midline (which is y = 0, since the graph passes through the origin and is symmetric about the x - axis) to the peak. The peak is at y = 3? Wait, no, let's check the graph. The graph goes from, say, the trough at y=-3 and peak at y = 3? Wait, no, maybe the amplitude is the distance from the midline (y = 0) to the peak. So if the peak is at y = 3, then amplitude is 3? Wait, no, wait the graph: let's see the vertical axis. The maximum value (the height of the peak) from the x - axis (midline) is 3? Wait, no, maybe I made a mistake. Wait, the formula for amplitude is also the absolute value of the coefficient of the sine or cosine function. Alternatively, amplitude is the maximum y - value (since midline is y = 0 here). Wait, looking at the graph, the peaks are at y = 3? Wait, no, maybe the amplitude is 3? Wait, no, wait let's recalculate. The midline is y = 0 (because the function is symmetric about the x - axis, passes through the origin). The maximum value (peak) is 3, minimum is - 3. So amplitude is $\frac{3-(-3)}{2}=\frac{6}{2}=3$. Wait, but maybe the graph's peak is at y = 3? Wait, no, maybe I misread. Wait, the user's graph: the y - axis has marks, and the peak is at y = 3? Wait, no, maybe the amplitude is 3? Wait, no, wait another way: amplitude is the distance from the midline to the peak. If midline is y = 0, and peak is at y = 3, then amplitude is 3. But wait, let's check again. Wait, maybe the peak is at y = 3? Wait, no, maybe I made a mistake. Wait, the correct way: amplitude = |maximum value - midline|. Since midline is 0, and maximum value is 3, amplitude is 3. But wait, let's see the graph again. The graph shows that the function goes up to 3 and down to - 3, so the amplitude is 3. Wait, but wait, maybe the amplitude is 3? Wait, no, wait I think I see the mistake. Wait, the graph: the vertical axis, the peak is at y = 3? Wait, no, maybe the amplitude is 3? Wait, no, let's do it again. The formula for the amplitude of a sinusoidal function $y = A\sin(Bx + C)+D$ is $|A|$, where D is the midline. Here, D = 0 (since the graph is centered at the x - axis). The maximum value of $y$ is $|A|$ and minimum is $-|A|$. From the graph, the maximum y - value (peak) is 3, so $|A|=3$, so amplitude is 3. Wait, but wait, maybe the graph's peak is at y = 3? So the amplitude is 3. But wait, let's check the calculation again. If the maximum is 3 and minimum is - 3, then amplitude is (3 - (-3))/2=3. Yes, that's correct.
Wait, no, wait a second. Wait, maybe I misread the graph. Let me look at the graph again. The user's graph: the y - axis has labels? Let's see, the vertical axis: the top is 6, then 4, 2, 0, -2, -4, -6? No, the original graph: the y - axis is marked with 6, 4, 2, 0, -2, -4, -6? Wait, no, the user's graph: the right - hand side, the y - axis has marks. Wait, the peak is at y = 3? Wait, no, maybe the amplitude is 3? Wait, no, I…

Snap & solve any problem in the app
Get step-by-step solutions on Sovi AI
Photo-based solutions with guided steps
Explore more problems and detailed explanations
3