QUESTION IMAGE
Question
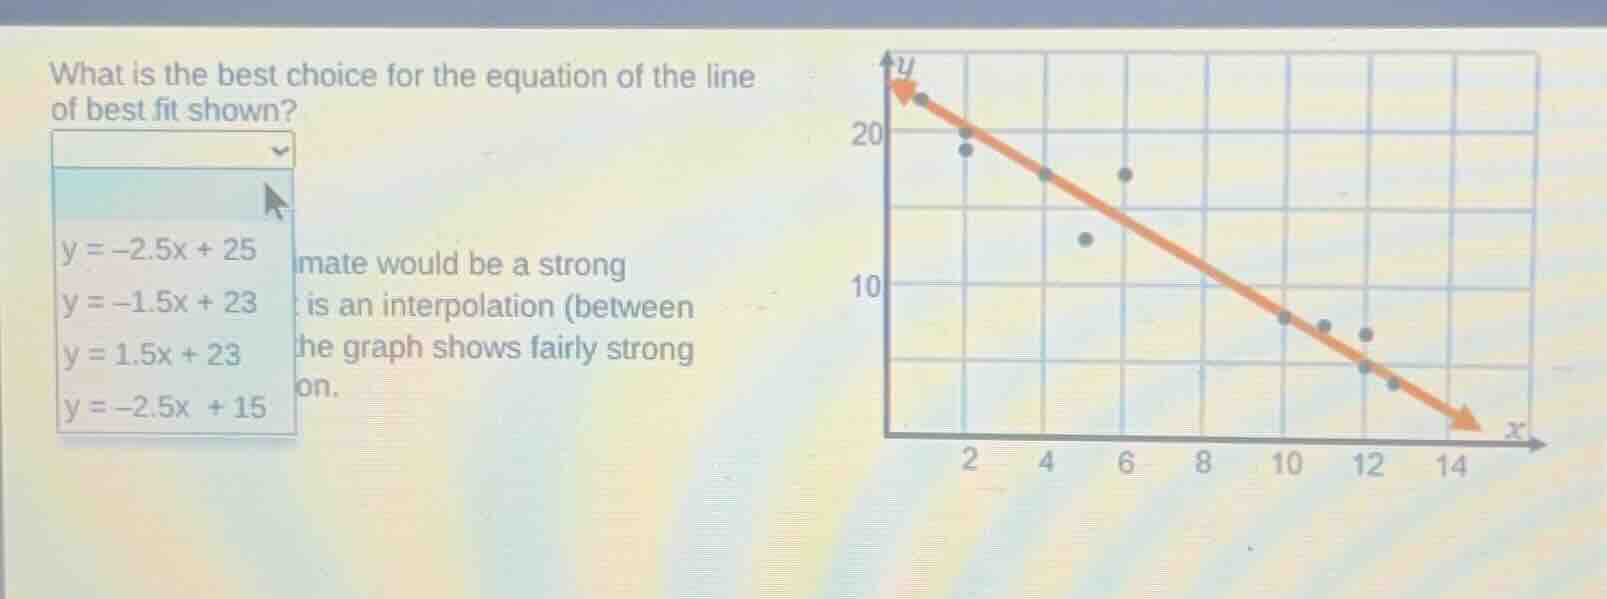
what is the best choice for the equation of the line of best fit shown?
y = -2.5x + 25
y = -1.5x + 23
y = 1.5x + 23
y = -2.5x + 15
imate would be a strong
is an interpolation (between
the graph shows fairly strong
on.
Step1: Analyze the slope
The line of best fit is decreasing, so the slope should be negative. This eliminates the option \( y = 1.5x + 23 \) (positive slope).
Step2: Analyze the y - intercept
When \( x = 0 \), the line intersects the y - axis. From the graph, when \( x = 0 \), the y - value is around 23 - 25. Let's check the y - intercepts of the remaining options:
- For \( y=-2.5x + 25 \), y - intercept is 25.
- For \( y=-1.5x + 23 \), y - intercept is 23.
- For \( y=-2.5x + 15 \), y - intercept is 15 (too low as per the graph).
Step3: Analyze the slope magnitude
Looking at the graph, the line is relatively steep (since the change in y over change in x is significant). The slope of \( - 2.5 \) (from \( y=-2.5x + 25 \)) is steeper than \( -1.5 \) (from \( y=-1.5x + 23 \)). Also, when we check a point on the line, for example, when \( x = 2 \), the line on the graph has a y - value around 20. Let's substitute \( x = 2 \) into the remaining equations:
- For \( y=-2.5x + 25 \), \( y=-2.5\times2 + 25=-5 + 25 = 20 \) (matches the graph's point at \( x = 2 \) approximately).
- For \( y=-1.5x + 23 \), \( y=-1.5\times2+23=-3 + 23 = 20 \) (also gives 20, but let's check another point. When \( x = 10 \), for \( y=-2.5x + 25 \), \( y=-2.5\times10+25=-25 + 25 = 0 \)? Wait, no, wait the graph at \( x = 10 \) has a y - value around 8 - 10? Wait, maybe my earlier check was wrong. Wait, let's re - evaluate. Wait, when \( x = 0 \), the line is at y≈23 - 25. When \( x = 10 \), the line on the graph is at y≈8. Let's calculate the slope between (0,23 - 25) and (10,8). The slope \( m=\frac{8 - 25}{10-0}=\frac{- 17}{10}=-1.7 \), close to - 1.5? Wait, no, maybe I made a mistake. Wait, the line of best fit in the graph: let's take two points. Let's say when \( x = 0 \), y≈23 - 25, and when \( x = 10 \), y≈8. The slope is \( \frac{8 - 23}{10-0}=\frac{-15}{10}=-1.5 \), but wait the line looks steeper. Wait, maybe the first point I took was wrong. Wait, the line starts at the top left, going down. Let's check the point at \( x = 2 \), y≈20. For \( y=-2.5x + 25 \), at \( x = 2 \), y = 20. At \( x = 4 \), \( y=-2.5\times4+25=-10 + 25 = 15 \). At \( x = 10 \), \( y=-2.5\times10+25=-25 + 25 = 0 \)? No, that doesn't match the graph. Wait, maybe the correct equation is \( y=-2.5x + 25 \) is wrong. Wait, let's check the other option. Wait, when \( x = 2 \), \( y=-1.5x + 23=-3 + 23 = 20 \) (matches). When \( x = 10 \), \( y=-1.5\times10+23=-15 + 23 = 8 \) (matches the graph's y - value at \( x = 10 \) which is around 8). Wait, but earlier I thought the slope was steeper. Wait, maybe the slope is - 1.5. But wait, the line in the graph seems to have a steeper slope. Wait, maybe my mistake was in the point selection. Wait, let's check the equation \( y=-2.5x + 25 \). At \( x = 4 \), \( y=-10 + 25 = 15 \). At \( x = 10 \), \( y=-25 + 25 = 0 \), but the graph at \( x = 10 \) has y≈8. So that's not matching. For \( y=-1.5x + 23 \), at \( x = 10 \), \( y = 8 \) (matches). At \( x = 4 \), \( y=-1.5\times4+23=-6 + 23 = 17 \). The graph at \( x = 4 \) has a point around 17? Wait, the graph has a point at \( x = 4 \) (the orange line) at y≈17? Wait, the orange line at \( x = 4 \) is at y≈17, and the data point is around there. Then at \( x = 6 \), the orange line is at y≈14, and the data point is around 13 - 14. At \( x = 10 \), the orange line is at y≈8, and the data points are around 8 - 10. So \( y=-1.5x + 23 \) seems to fit? But wait, the initial check for \( y=-2.5x + 25 \) at \( x = 2 \) was 20, which matches, but at \( x = 10 \) it was 0, which doesn't. Wait, m…

Snap & solve any problem in the app
Get step-by-step solutions on Sovi AI
Photo-based solutions with guided steps
Explore more problems and detailed explanations
\( y = -2.5x + 25 \)