QUESTION IMAGE
Question
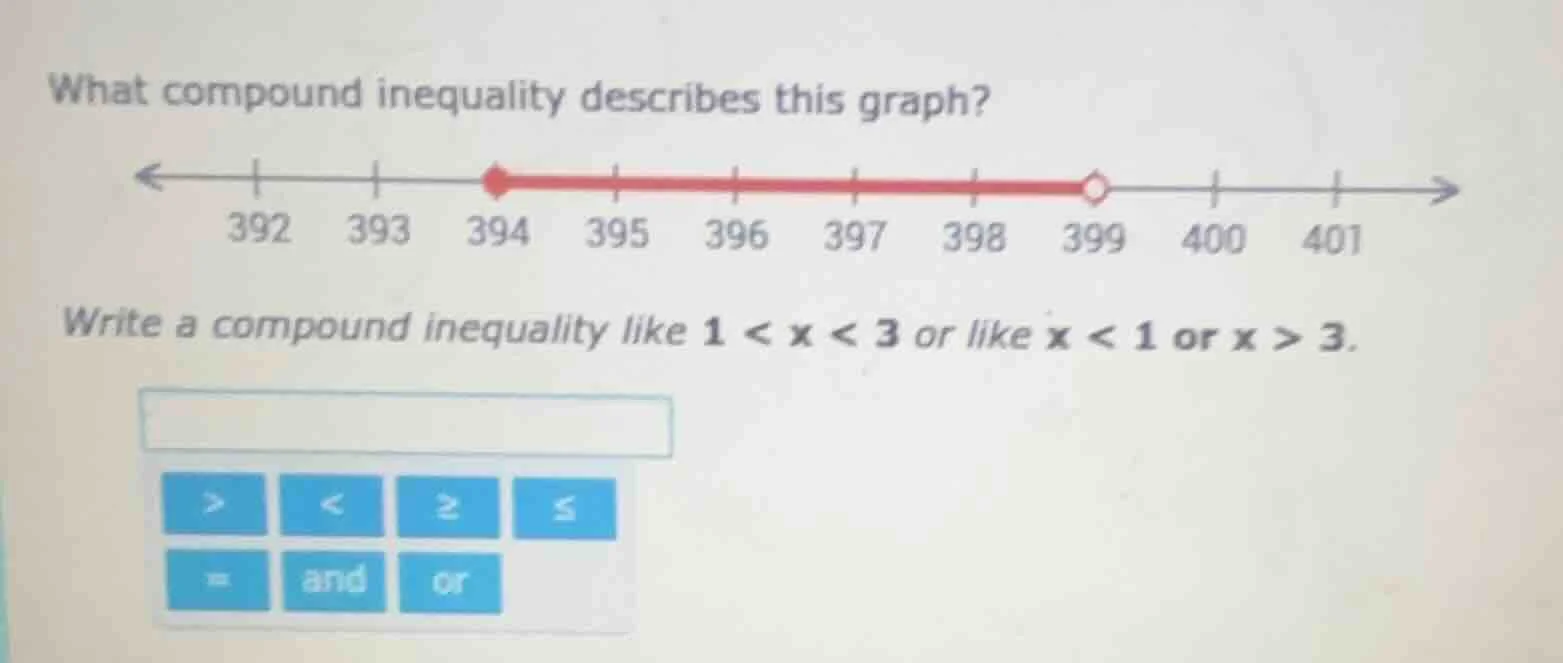
what compound inequality describes this graph?
<---|---|---|---|---|---|---|---|---|------>
392 393 394 395 396 397 398 399 400 401
(red line from 394 (closed dot) to 399 (open dot))
write a compound inequality like 1 < x < 3 or like x < 1 or x > 3.
input box
buttons: >, <, ≥, ≤, =, and, or
Step1: Analyze the left endpoint
The left endpoint is a closed circle at 394, so \( x \) is greater than or equal to 394, which is \( x \geq 394 \).
Step2: Analyze the right endpoint
The right endpoint is an open circle at 399, so \( x \) is less than 399, which is \( x < 399 \).
Step3: Combine the inequalities
Since the graph shows the region between these two points, we use "and" to combine them. So the compound inequality is \( 394 \leq x < 399 \).

Snap & solve any problem in the app
Get step-by-step solutions on Sovi AI
Photo-based solutions with guided steps
Explore more problems and detailed explanations
\( 394 \leq x < 399 \)