QUESTION IMAGE
Question
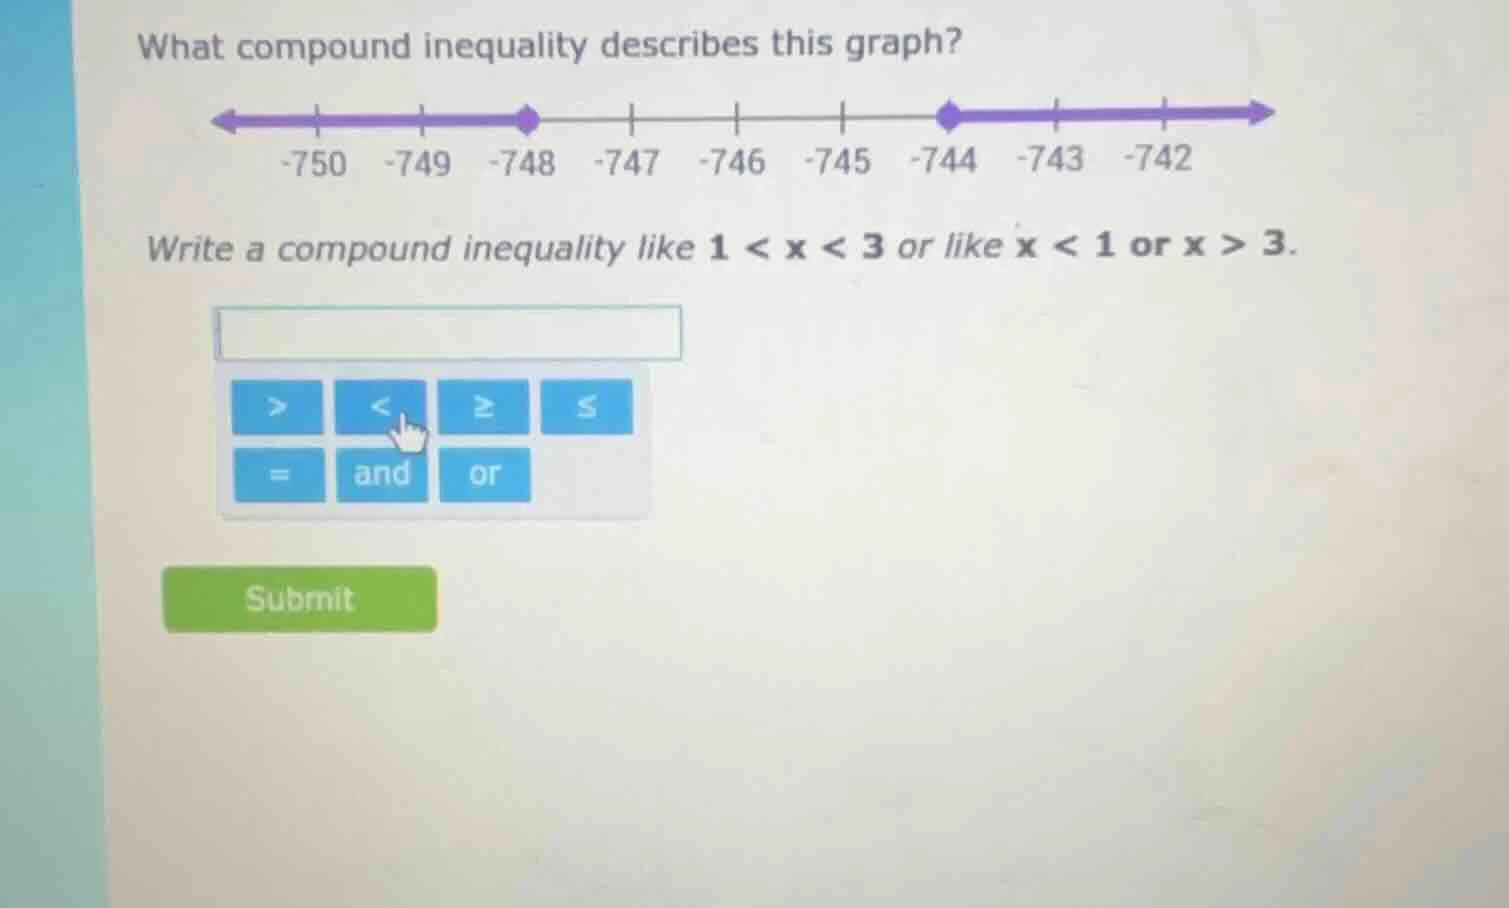
what compound inequality describes this graph?
-750 -749 -748 -747 -746 -745 -744 -743 -742
write a compound inequality like 1 < x < 3 or like x < 1 or x > 3.
submit
Step1: Analyze the left segment
The left purple segment has a closed dot at -748, so \( x \leq -748 \).
Step2: Analyze the right segment
The right purple segment has a closed dot at -744, so \( x \geq -744 \).
Step3: Combine the inequalities
Since the graph has two separate segments, we use "or" to combine the inequalities: \( x \leq -748 \) or \( x \geq -744 \).

Snap & solve any problem in the app
Get step-by-step solutions on Sovi AI
Photo-based solutions with guided steps
Explore more problems and detailed explanations
\( x \leq -748 \) or \( x \geq -744 \)