QUESTION IMAGE
Question
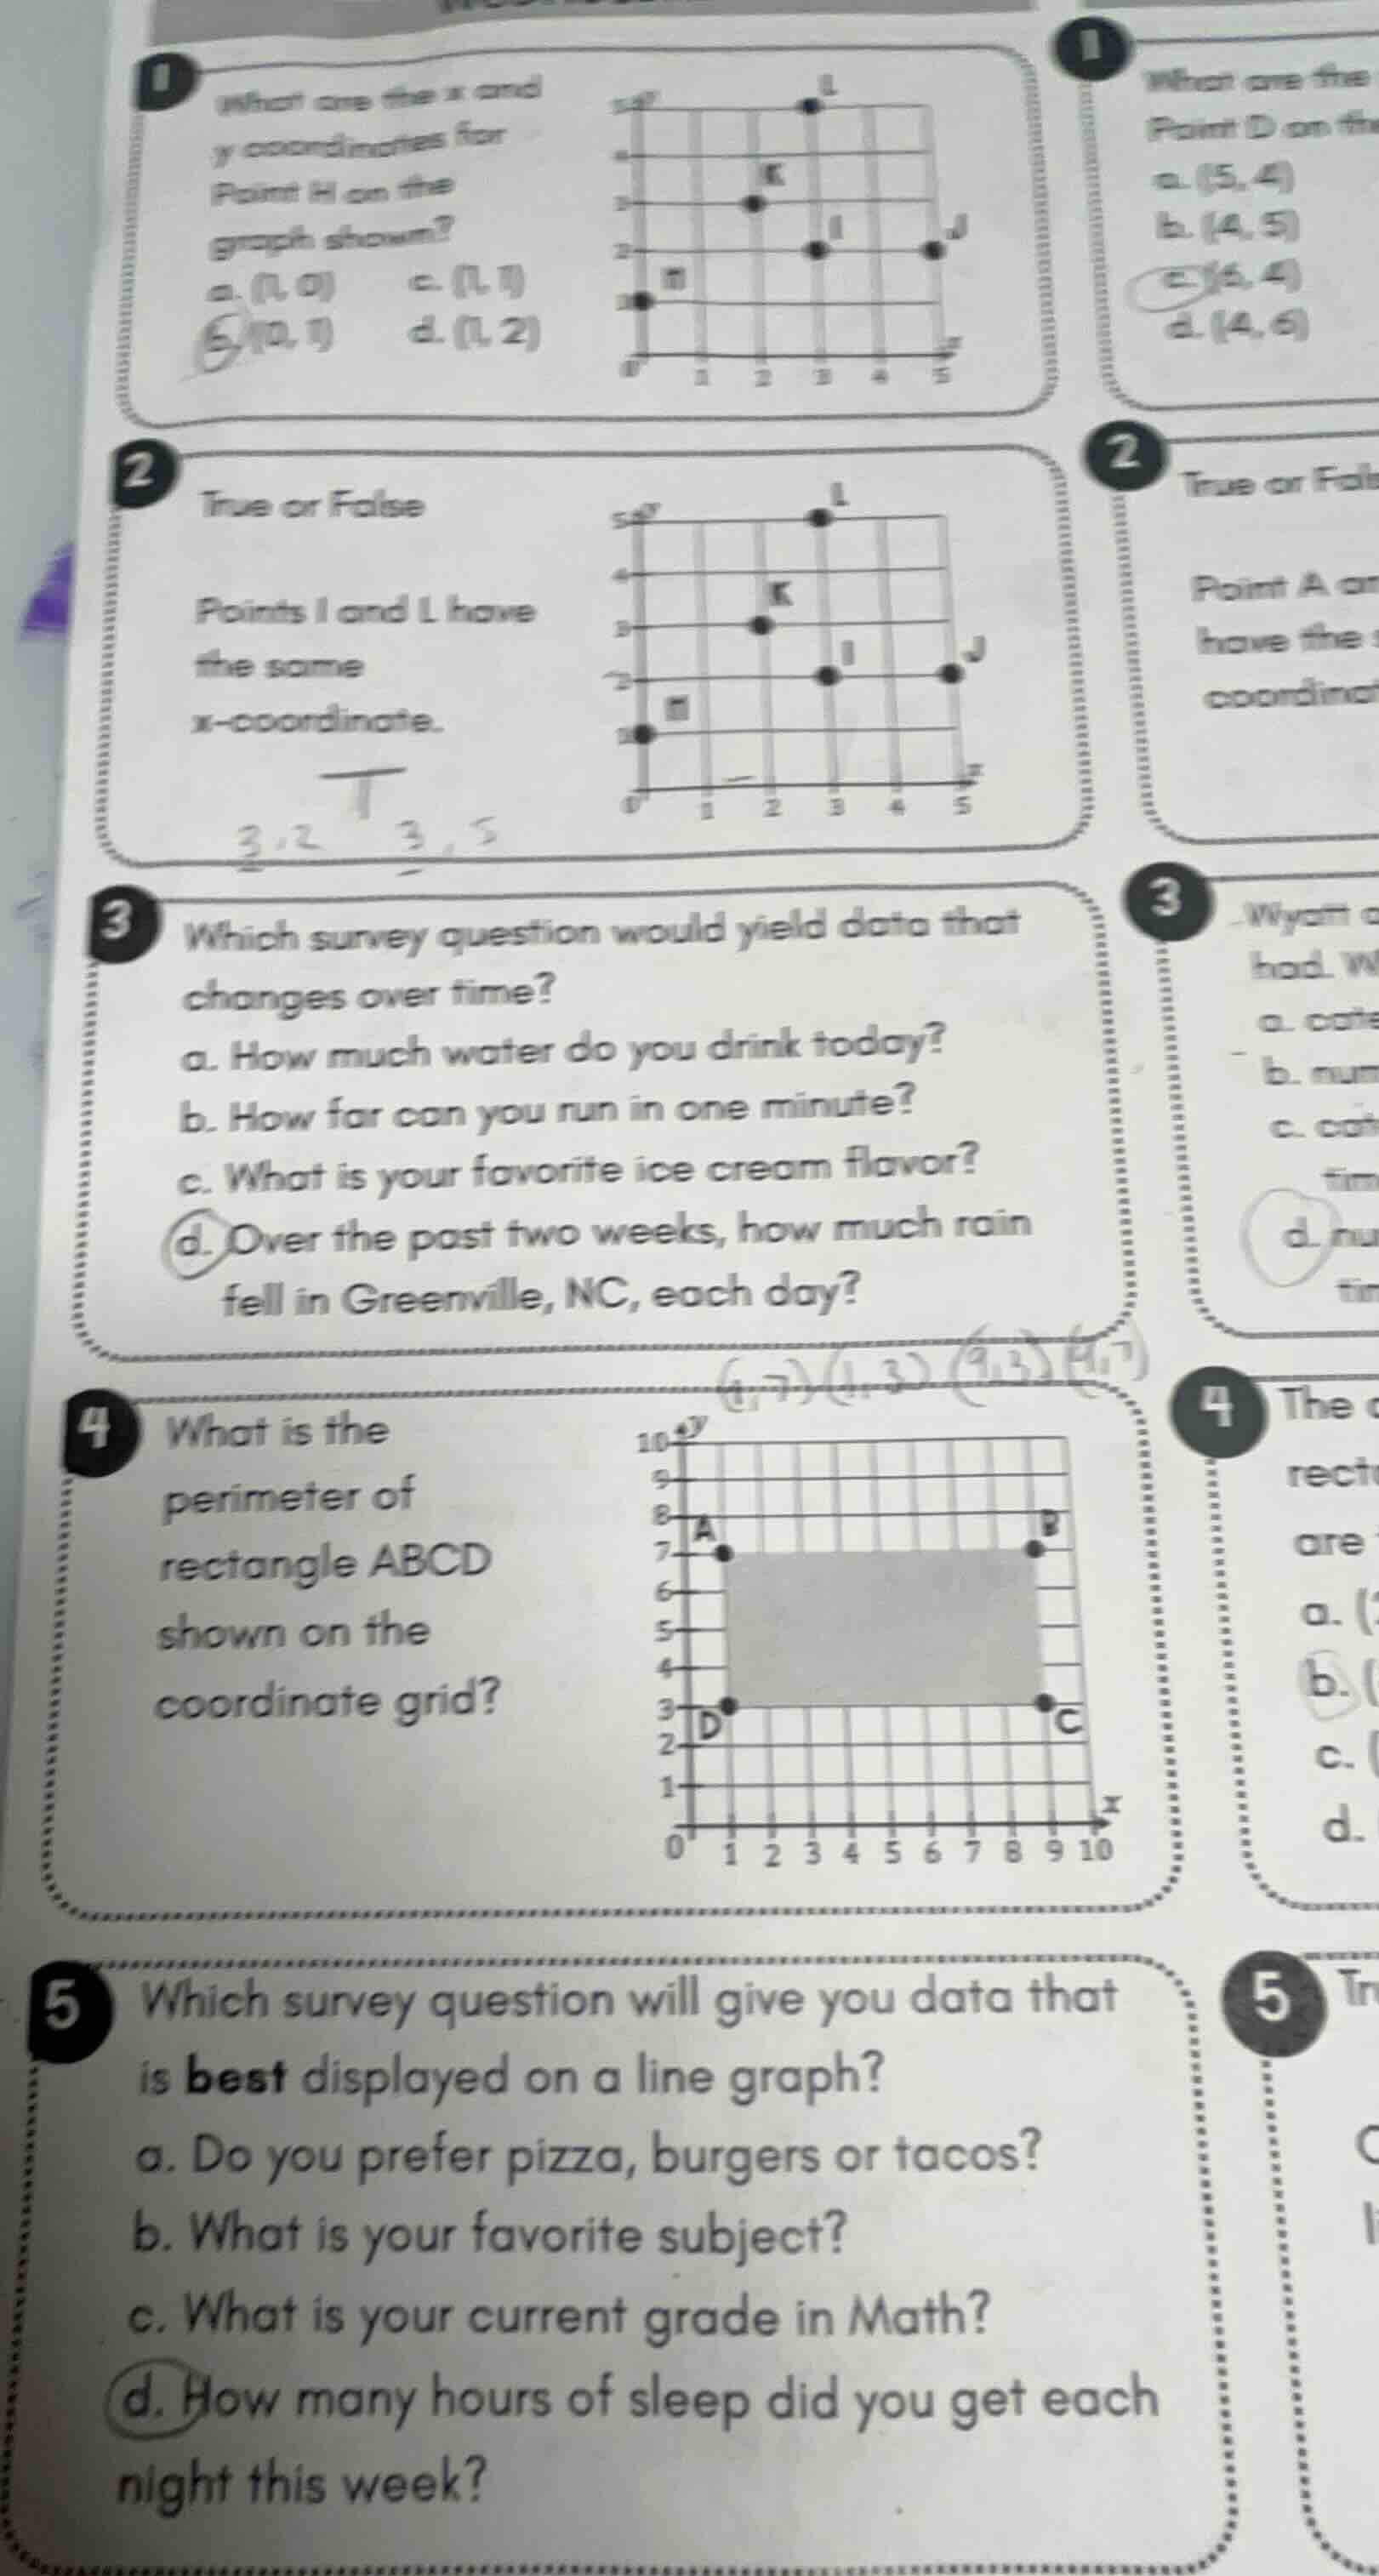
1 what are the x and y coordinates for point h on the graph shown? a. (1, 0) c. (1, 1) b. (0, 1) d. (1, 2) 2 true or false points i and l have the same x - coordinate. 3 which survey question would yield data that changes over time? a. how much water do you drink today? b. how far can you run in one minute? c. what is your favorite ice cream flavor? d. over the past two weeks, how much rain fell in greenville, nc, each day? 4 what is the perimeter of rectangle abcd shown on the coordinate grid? 5 which survey question will give you data that is best displayed on a line graph? a. do you prefer pizza, burgers or tacos? b. what is your favorite subject? c. what is your current grade in math? d. how many hours of sleep did you get each night this week?
Question 1
Step1: Recall coordinate system rules
In a coordinate system, the \(x\)-coordinate is the horizontal (left - right) value and the \(y\)-coordinate is the vertical (up - down) value. For Point \(H\), looking at the graph, it is on the \(y\)-axis (so \(x = 0\)) and at \(y=1\).
Step1: Find coordinates of Points \(I\) and \(L\)
From the graph, Point \(I\) has coordinates \((3, 2)\) and Point \(L\) has coordinates \((3, 5)\). The \(x\)-coordinate for both is \(3\), so they have the same \(x\)-coordinate.
Step1: Analyze each option
- Option a: "How much water do you drink today?" gives a single - day value, not time - varying over a period.
- Option b: "How far can you run in one minute?" is a measure of ability, not time - varying data.
- Option c: "What is your favorite ice cream flavor?" is a preference, not time - varying.
- Option d: "Over the past two weeks, how much rain fell in Greenville, NC, each day?" gives data for each day over two weeks, which changes over time.

Snap & solve any problem in the app
Get step-by-step solutions on Sovi AI
Photo-based solutions with guided steps
Explore more problems and detailed explanations
b. \((0, 1)\)